Month-to-Month Sales Comparison Log
Understanding this form
The Month-to-Month Sales Comparison Log is a record-keeping tool designed to help businesses compare their sales performance across different months. This form allows staff to track taxable and nontaxable sales, providing clear insights into business trends over time. Unlike other sales reports, this log focuses specifically on month-to-month comparisons for enhanced planning and analysis.
Key components of this form
- Year of record-keeping: Fill in the year for which sales are being logged.
- Monthly entries: A section for each month from January to December to document sales figures.
- Taxable sales: Spaces for entering sales that are subject to taxation.
- Nontaxable sales: Spaces for recording sales that are exempt from taxes.
- Total sales: A calculated field for summing taxable and nontaxable sales for each month.
Common use cases
You should use the Month-to-Month Sales Comparison Log when you need to monitor sales trends throughout a fiscal year. This form is particularly useful for businesses that want to evaluate their monthly performance, assess seasonal fluctuations, and make informed financial decisions based on historical sales data.
Who needs this form
- Small business owners tracking monthly sales trends.
- Managers analyzing sales performance of their teams.
- Finance professionals preparing quarterly or annual business reports.
- Retailers assessing product performance across different months.
Completing this form step by step
- Identify the year for which sales will be recorded and enter it at the top of the form.
- For each month, enter the figures for taxable sales in the corresponding space.
- Next, input any nontaxable sales that occurred during that month.
- Calculate the total sales for each month by adding the taxable and nontaxable sales.
- Ensure all monthly entries are completed before saving or printing the log for future reference.
Notarization requirements for this form
This form does not typically require notarization unless specified by local law. Always check local regulations to ensure compliance, especially if the log is used for formal reporting.
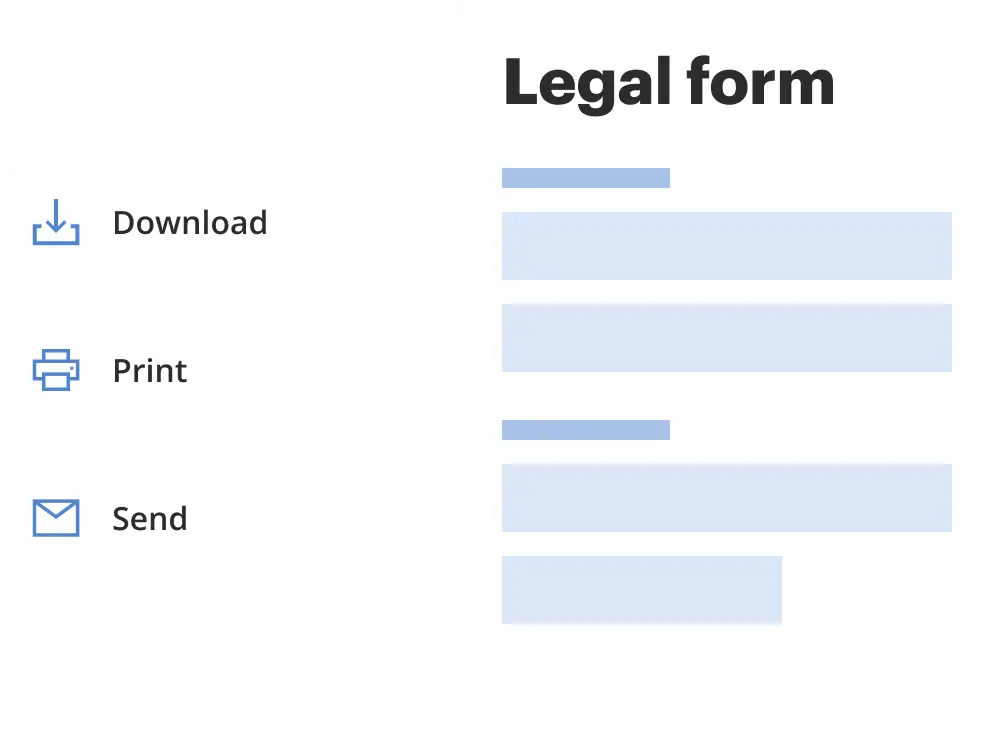
Get your form ready online
Our built-in tools help you complete, sign, share, and store your documents in one place.
Make edits, fill in missing information, and update formatting in US Legal Forms—just like you would in MS Word.
Download a copy, print it, send it by email, or mail it via USPS—whatever works best for your next step.
Sign and collect signatures with our SignNow integration. Send to multiple recipients, set reminders, and more. Go Premium to unlock E-Sign.
If this form requires notarization, complete it online through a secure video call—no need to meet a notary in person or wait for an appointment.
We protect your documents and personal data by following strict security and privacy standards.
Make edits, fill in missing information, and update formatting in US Legal Forms—just like you would in MS Word.
Download a copy, print it, send it by email, or mail it via USPS—whatever works best for your next step.
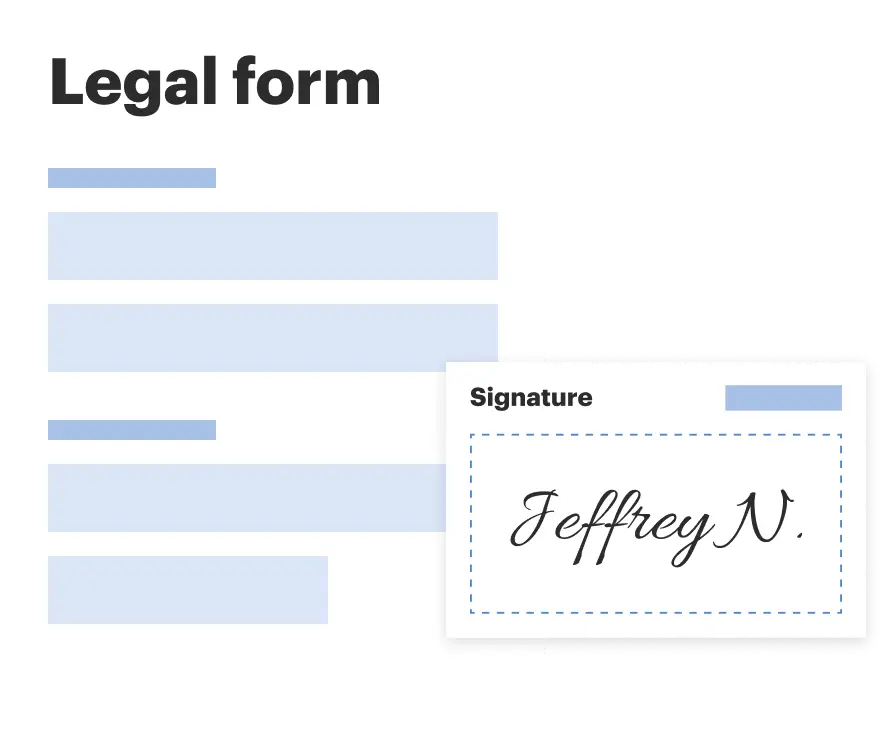
Sign and collect signatures with our SignNow integration. Send to multiple recipients, set reminders, and more. Go Premium to unlock E-Sign.

If this form requires notarization, complete it online through a secure video call—no need to meet a notary in person or wait for an appointment.
We protect your documents and personal data by following strict security and privacy standards.
Common mistakes to avoid
- Failing to include all sales sources, leading to incomplete data.
- Not updating the log monthly, which can result in missed trends.
- Incorrectly calculating totals for each month, which can affect financial analysis.
Why use this form online
- Convenience of accessing and filling the form from anywhere at any time.
- Easy to edit fields, allowing for quick updates if sales figures change.
- Reliable storage options for keeping important financial records secure.
Key takeaways
- The Month-to-Month Sales Comparison Log is essential for businesses to monitor sales trends effectively.
- This form provides a clear layout for tracking both taxable and nontaxable sales.
- Regularly updating this log can enhance decision-making and financial planning.
Looking for another form?

Form popularity
FAQ
Create a chart Select the data for which you want to create a chart. Click INSERT > Recommended Charts. On the Recommended Charts tab, scroll through the list of charts that Excel recommends for your data, and click any chart to see how your data will look.When you find the chart you like, click it > OK.
As below screenshot shown, supposing you need to compare two date lists and match the dates by month and year only, you can apply the below formula to achieve it. 1. Select a blank cell, enter formula =MONTH(A2)&YEAR(A2)=MONTH(B2)&YEAR(B2) into the Formula Bar, and then press the Enter key.
Create Monthly Sales Report in Excel (Make Product wise- YouTube YouTube Start of suggested clip End of suggested clip Months in the columns. That's why drag this. Month first touch and hold this then drag this toMoreMonths in the columns. That's why drag this. Month first touch and hold this then drag this to column. Level. In this way.
Use Combo Chart as Comparison Chart in Excel.
To compare current sales to previous best month, I used a simple logic with the DIVIDE function. Subtract the Highest Previous Sales Mth from our Total Sales and then divide the difference by the Highest Previous Sales Mth.
An Insert Chart wizard will appear. Click on the All Charts tab. Sequentially, click on the Column option. Select a pattern of chart type. I have chosen Clustered Column option. Finally, click on OK to finish the process.
A Comparison Bar Chart is arguably among the most straightforward visualization designs best suited for displaying month-to-month insights.