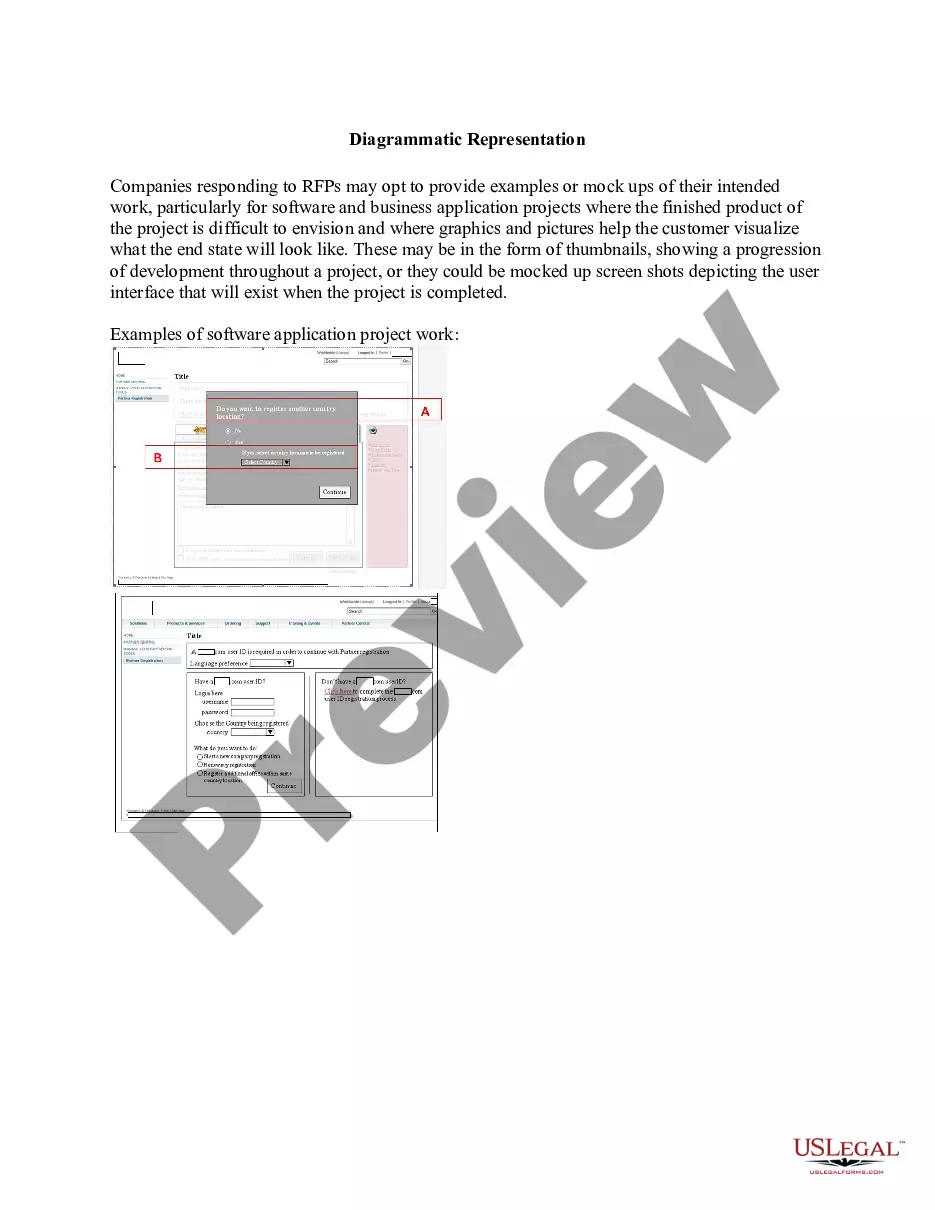
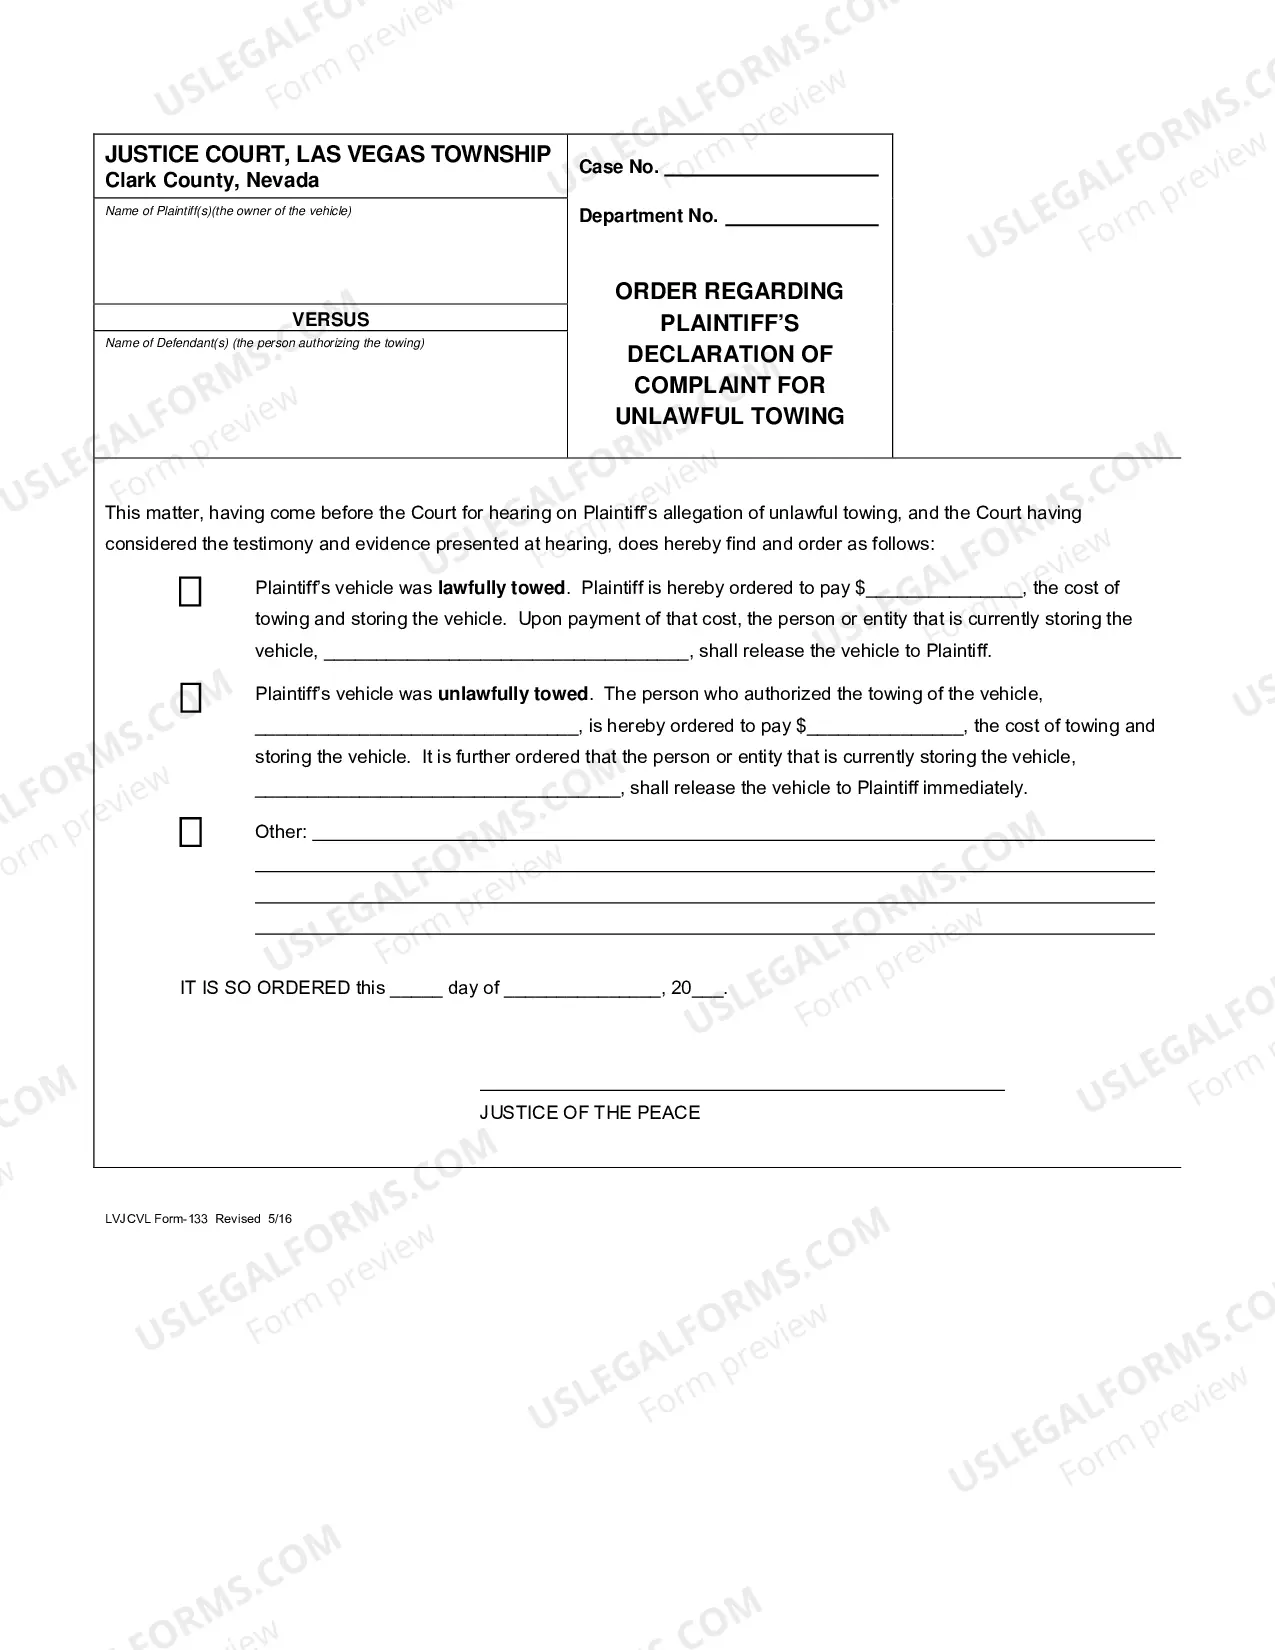
Diagrams and Tables
What is this form?
The Diagrams and Tables form provides a clear, organized display of various diagrams and tables relevant to a proposal, which aids in understanding complex workflows and information. This form ensures that users can easily reference key visuals, streamlining the presentation of data and functionality in a professional format. Unlike general report templates, this form focuses explicitly on visual aids and their explanations, making it essential for proposals that heavily rely on graphical representations.
Main sections of this form
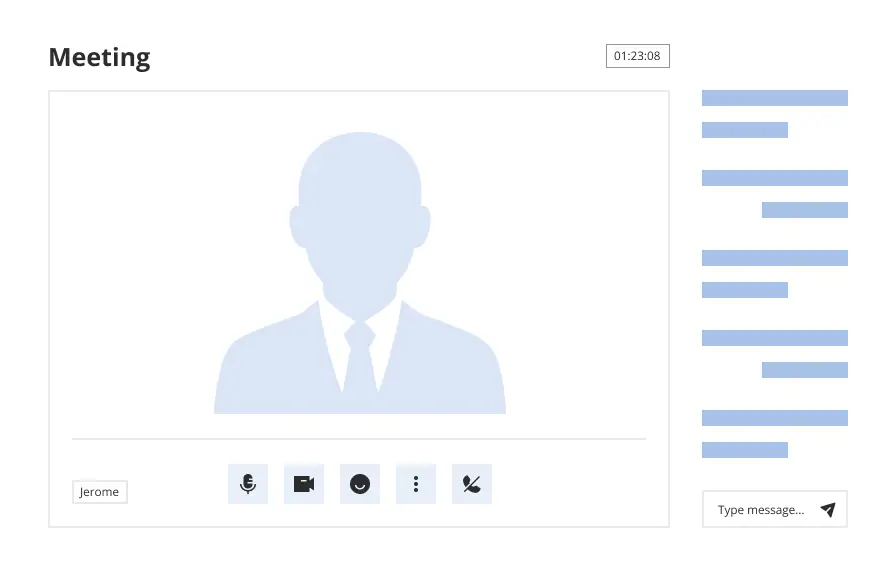
- Diagram 1: Workflow in co-resident environment
- Diagram 2: Workflow - standalone installation
- Diagram 3: Profile screen
- Diagram 4: Folder screen
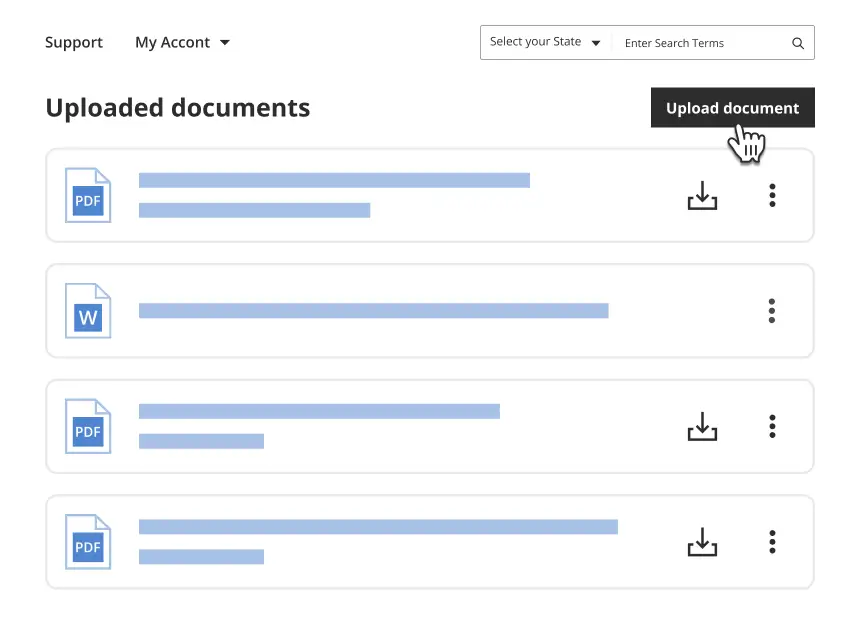
- Table 1: How to... reference chart
- Table 2: Troubleshooting guide
- Table 3: Frequently asked questions (FAQs)
When this form is needed
This form is useful when creating proposals that include intricate workflows, systems, or data visualizations. It can be used in environments such as software installations, project management outlines, or any documentation needing clear graphical representation. Utilizing this form can enhance understanding for stakeholders and team members.
Intended users of this form
- Project managers preparing detailed proposals
- Technical writers documenting system workflows
- Business analysts presenting complex information visually
- Anyone involved in creating comprehensive documentation that requires diagrams and tables
Steps to complete this form
- Identify the specific diagrams and tables to be included in your proposal.
- Clearly label each diagram and table with a corresponding reference number.
- Provide a brief description or explanation for each diagram/table to add context.
- Ensure that all visuals are properly formatted and easy to read.
- Incorporate any necessary troubleshooting or FAQ tables relevant to the visuals.
Does this form need to be notarized?
Notarization is not commonly needed for this form. However, certain documents or local rules may make it necessary. Our notarization service, powered by Notarize, allows you to finalize it securely online anytime, day or night.
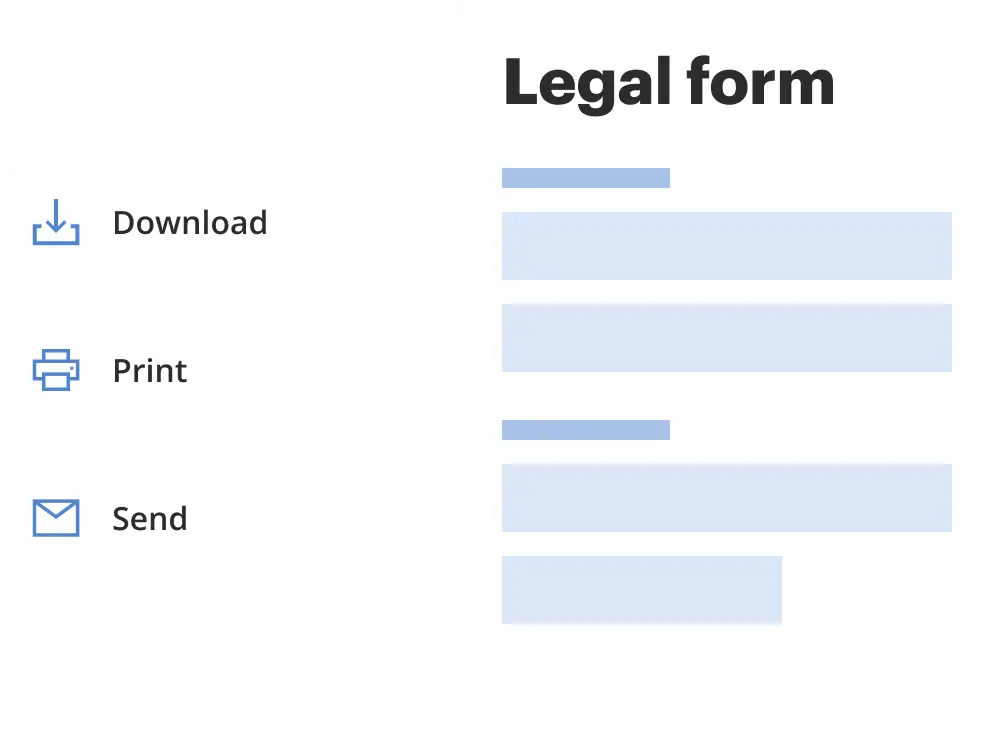
Get your form ready online
Our built-in tools help you complete, sign, share, and store your documents in one place.
Make edits, fill in missing information, and update formatting in US Legal Forms—just like you would in MS Word.
Download a copy, print it, send it by email, or mail it via USPS—whatever works best for your next step.
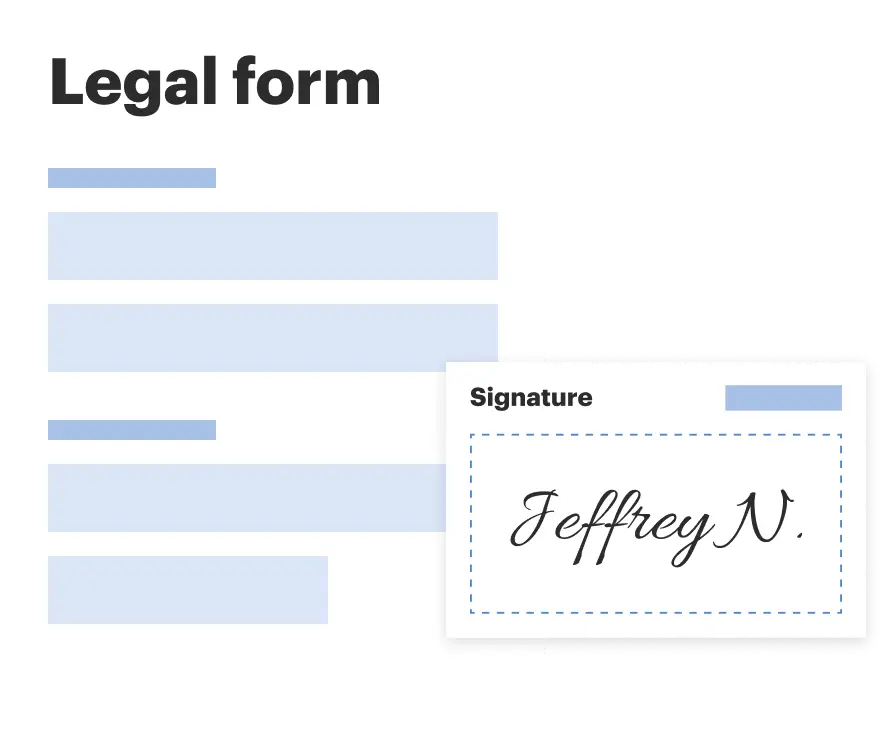
Sign and collect signatures with our SignNow integration. Send to multiple recipients, set reminders, and more. Go Premium to unlock E-Sign.
If this form requires notarization, complete it online through a secure video call—no need to meet a notary in person or wait for an appointment.
We protect your documents and personal data by following strict security and privacy standards.
Make edits, fill in missing information, and update formatting in US Legal Forms—just like you would in MS Word.
Download a copy, print it, send it by email, or mail it via USPS—whatever works best for your next step.
Sign and collect signatures with our SignNow integration. Send to multiple recipients, set reminders, and more. Go Premium to unlock E-Sign.
If this form requires notarization, complete it online through a secure video call—no need to meet a notary in person or wait for an appointment.
We protect your documents and personal data by following strict security and privacy standards.
Typical mistakes to avoid
- Failing to label diagrams and tables clearly, leading to confusion.
- Overusing complex language that complicates visual understanding.
- Neglecting to provide descriptions for diagrams, which can diminish their effectiveness.
- Including unnecessary visuals that do not enhance the proposal.
Why complete this form online
- Convenient download options allow for quick access and easy editing.
- Designed by licensed attorneys, ensuring legal compliance and appropriateness.
- Streamlined organization makes it easier to present complex information professionally.
- Available for customization to meet specific project needs.
Looking for another form?


Form popularity
FAQ
Figures are visual presentations of results. They come in the form of graphs, charts, drawings, photos, or maps. Figures provide visual impact and can effectively communicate your primary finding.
When it comes to psychology and many other subjects, you will probably notice that results are often written and displayed in the form of tables, charts and graphs in research. The purpose of this is to allow readers to interpret and visually understand the study results easily.
Tables should be labeled with a number preceding the table title; tables and figures are labeled independently of one another. Tables should also have lines demarcating different parts of the table (title, column headers, data, and footnotes if present). Gridlines or boxes should not be included in printed versions.
Tables and graphs are visual representations of data used to organise information to show patterns and relationships. Researchers and scientists often use tables and graphs to report findings from their research.
Visual elements are referred to as either Tables or Figures. Tables are made up of rows and columns and the cells usually have numbers in them (but may also have words or images). Figures refer to any visual elements?graphs, charts, diagrams, photos, etc. ?that are not Tables.
Charts are tables, diagrams or pictures that organize large amounts of data clearly and concisely. People use charts to interpret current data and make predictions.