Diagrammatic Representation
Overview of this form
The Diagrammatic Representation form allows companies to visually convey their project proposals, particularly for software and business application projects. This form is essential for helping potential clients visualize the intended outcomes of complex projects through graphics, mockups, and screenshots. This form differs from standard proposals by focusing on graphical representation rather than just text, making it easier for clients to understand the project's vision and progress.
Main sections of this form
- Project overview: A brief description of the intended project and goals.
- Visual mockups: Images or diagrams that illustrate project milestones or user interfaces.
- Development progression: Thumbnails or images showing key phases of development.
- Client feedback sections: Areas for clients to express preferences and suggestions on visual components.
- Contact information: Details on how clients can reach the design team for queries.


When to use this document
This form is particularly useful when responding to Requests for Proposals (RFPs) where a visual representation can enhance understanding. Companies using this form can effectively illustrate how their proposed solutions will meet the client's needs, especially when dealing with projects that are conceptual or involve intricate designs. It helps facilitate discussions around project details and client expectations.
Who needs this form
- Businesses responding to RFPs from potential clients.
- Software developers and tech companies presenting application solutions.
- Design teams looking to visually communicate project concepts to clients.
- Consultants creating proposals for business applications or services that require visual aids.
How to complete this form
- Begin with a clear and concise project overview, stating the goals and objectives.
- Gather all visual mockups or graphics that represent your proposed solution.
- Include a timeline illustrating the development progression with relevant visuals.
- Allocate space for client feedback on each visual element presented.
- Ensure your contact information is included for any follow-up questions or clarifications.
Notarization guidance
Notarization is generally not required for this form. However, certain states or situations might demand it. You can complete notarization online through US Legal Forms, powered by Notarize, using a verified video call available anytime.
Get your form ready online
Our built-in tools help you complete, sign, share, and store your documents in one place.
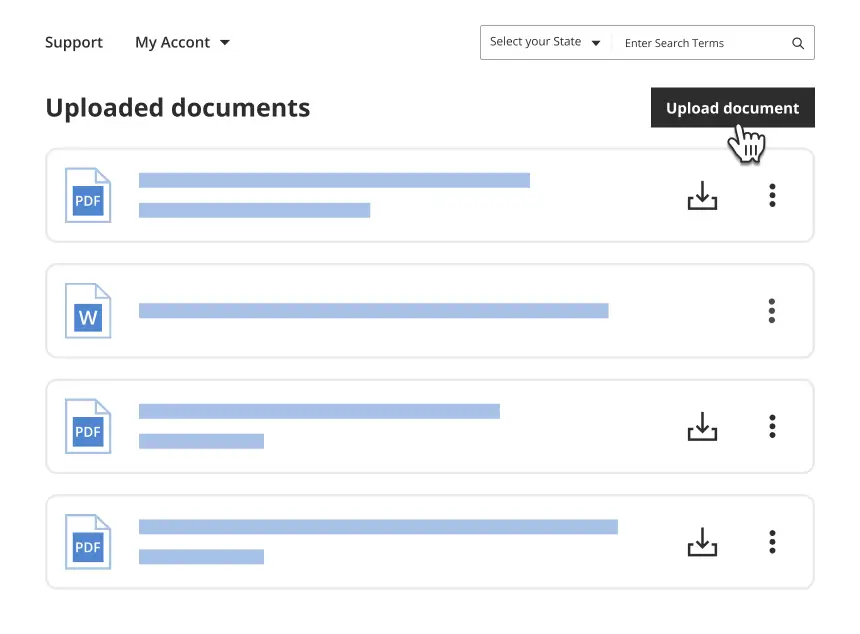
Make edits, fill in missing information, and update formatting in US Legal Forms—just like you would in MS Word.
Download a copy, print it, send it by email, or mail it via USPS—whatever works best for your next step.
Sign and collect signatures with our SignNow integration. Send to multiple recipients, set reminders, and more. Go Premium to unlock E-Sign.
If this form requires notarization, complete it online through a secure video call—no need to meet a notary in person or wait for an appointment.
We protect your documents and personal data by following strict security and privacy standards.
Make edits, fill in missing information, and update formatting in US Legal Forms—just like you would in MS Word.
Download a copy, print it, send it by email, or mail it via USPS—whatever works best for your next step.
Sign and collect signatures with our SignNow integration. Send to multiple recipients, set reminders, and more. Go Premium to unlock E-Sign.

If this form requires notarization, complete it online through a secure video call—no need to meet a notary in person or wait for an appointment.
We protect your documents and personal data by following strict security and privacy standards.
Mistakes to watch out for
- Including too much text instead of focusing on visuals.
- Failing to align graphics with project goals, which can confuse clients.
- Not providing options for client feedback, limiting engagement.
- Neglecting to update mockups as per client suggestions.
Why complete this form online
- Convenient access: Download and edit the form at your convenience.
- Easy customization: Tailor the form to fit the specific project needs and client preferences.
- Time-efficient: Quickly produce professional-looking mockups without extensive graphic design skills.
- Improved communication: Enhance interactions with clients through visual aids, making discussions clearer.
Legal use & context
- This form serves as a supporting document in a proposal, not a legally binding contract.
- It is best used in conjunction with formal contract discussion and agreements.
- Misrepresentation of visuals can lead to disputes, so accuracy is crucial.
Looking for another form?

Form popularity
FAQ
What is a Diagrammatic Presentation of Data? Diagrammatic representation refers to a representation of statistical data in the form of diagrams. The diagrams used in representing statistical data are geometrical figures, such as lines, bars, and circles.
Diagrammatic Presentation of Data. Diagrams play an important role in statistical data presentation. Diagrams are nothing but geometrical figures like lines, bars, circles, squares, etc. Diagrammatic data presentation allows us to understand the data in an easier manner.
To summarise, use graphics when you want to make a screen look visually appealing. Use diagrams when you are using an image to convey information to the learner.
The difference between the diagrammatic and graphical representation of data is that the diagrammatic representation of data shows how much each value deviates from the mean, while the graphical representation shows how the data are distributed.
Charts represent a large set of information in graphs, diagrams, or in the form of tables. At the same time, the graph shows the mathematical relationship between varied groups of data. It is a type of chart but not all of it. A graph is a type of subgroup of a chart.
Diagrams play an important role in statistical data presentation. Diagrams are nothing but geometrical figures like lines, bars, circles, squares, etc. Diagrammatic data presentation allows us to understand the data in an easier manner.
There are four main types considered here, which are spidergram, table, flowchart and tree diagram.
Concept of Diagrammatic Presentation Under pictograms, we use pictures to present data. For example, if we have to show the production of cars, we can draw cars. Suppose the production of cars is 40,000, we can show it by a picture having four cars, where 1 car represents 10,000 units.