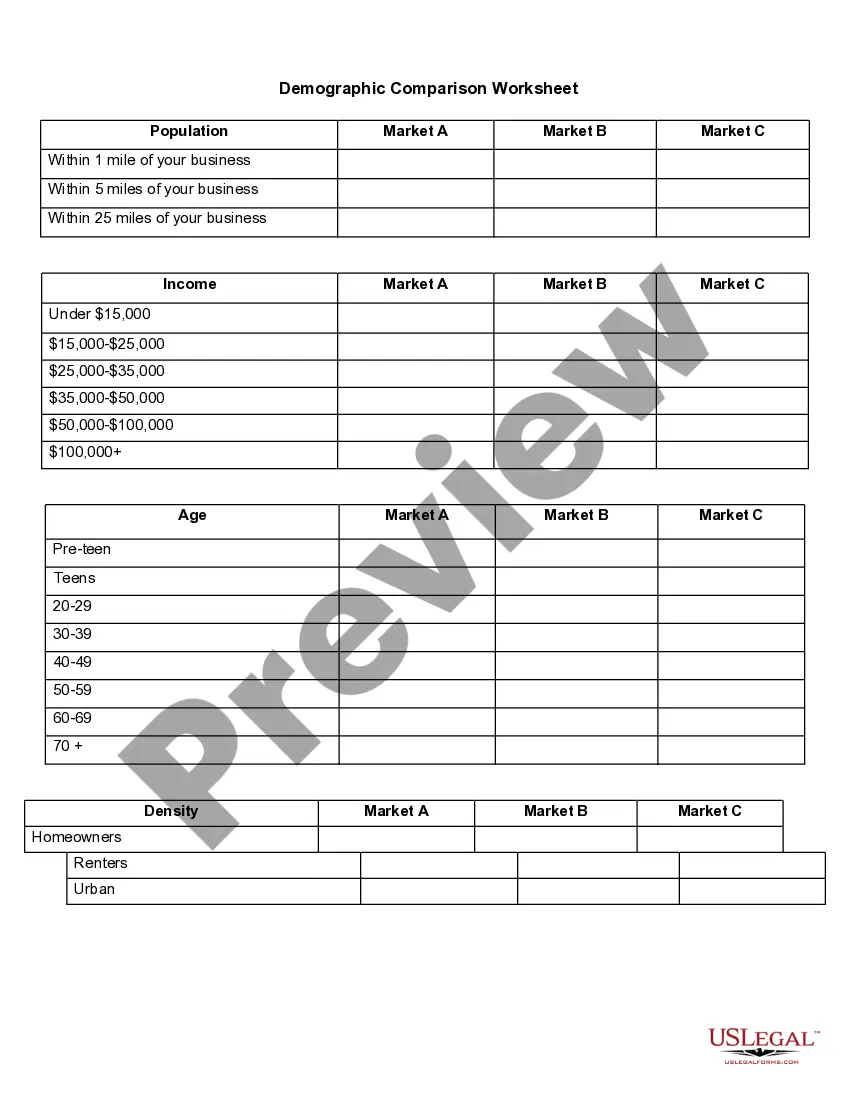
South Carolina Demographic Comparison Worksheet
Description
Get your form ready online
Our built-in tools help you complete, sign, share, and store your documents in one place.
Make edits, fill in missing information, and update formatting in US Legal Forms—just like you would in MS Word.
Download a copy, print it, send it by email, or mail it via USPS—whatever works best for your next step.
Sign and collect signatures with our SignNow integration. Send to multiple recipients, set reminders, and more. Go Premium to unlock E-Sign.
If this form requires notarization, complete it online through a secure video call—no need to meet a notary in person or wait for an appointment.
We protect your documents and personal data by following strict security and privacy standards.
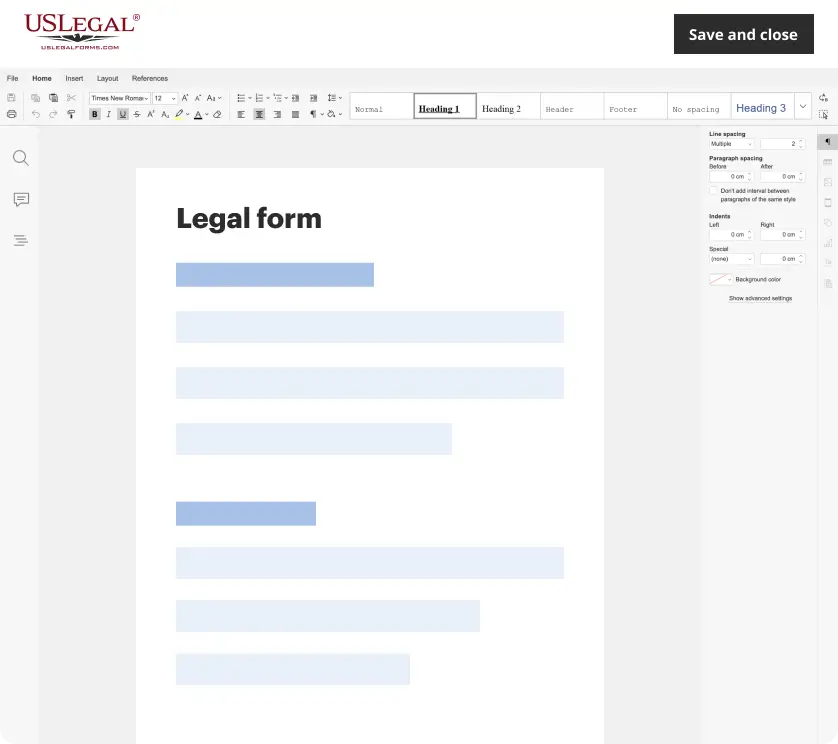
Make edits, fill in missing information, and update formatting in US Legal Forms—just like you would in MS Word.
Download a copy, print it, send it by email, or mail it via USPS—whatever works best for your next step.
Sign and collect signatures with our SignNow integration. Send to multiple recipients, set reminders, and more. Go Premium to unlock E-Sign.
If this form requires notarization, complete it online through a secure video call—no need to meet a notary in person or wait for an appointment.
We protect your documents and personal data by following strict security and privacy standards.
Looking for another form?
How to fill out Demographic Comparison Worksheet?
Have you ever found yourself in a situation where you require documents for either professional or personal reasons almost daily.
There are numerous legal form templates accessible online, yet discovering reliable versions can be challenging.
US Legal Forms offers a vast array of form templates, such as the South Carolina Demographic Comparison Worksheet, designed to meet state and federal standards.
Once you find the right form, click Buy now.
Choose your pricing plan, fill in the required details to create your account, and pay for your order using your PayPal or credit card.
- If you are already familiar with the US Legal Forms website and possess an account, simply Log In.
- Afterward, you can download the South Carolina Demographic Comparison Worksheet template.
- If you do not have an account and would like to start using US Legal Forms, follow these steps.
- Locate the form you need and make sure it is for the correct state/region.
- Utilize the Preview option to review the form.
- Check the description to ensure you have selected the accurate form.
- If the form is not what you are looking for, take advantage of the Lookup section to find the form that fits your needs.
Form popularity
FAQ
In July 2019, according to the new estimates, South Carolina's population was 63.7 percent non-Hispanic white. And, as in prior years, the majority of South Carolina's remaining non-Hispanic population was Black 26.4 percent last summer, 27.7 percent in 2010.
North Charleston #1 Most Diverse Places to Live in South Carolina.
The five largest ancestry groups in South Carolina identified by respondents to the US census are African American (29.5%), American (13.9%), English (8.4%), German (8.4%) and Irish (7.9%) (thus a total of more than 39% from northern Europe).
Texas has the highest Black population in the United States of 3,936,669, about 14% of Texas's total population.
There were more South Carolina residents of every race and ethnic group in 2019, compared to 2010, but non-Hispanic white and Black residents account for more than 90 percent of South Carolina's population, compared to less than 73 percent of the U.S. population.
Lancaster County is 75 percent white and 22 percent black among its nearly 93,000 residents. More than 5 percent of residents are Hispanic. Chester County is 60 percent white compared to 37 percent, with 2 percent also listed as Hispanic or Latino. Chester County is about a third the size of Lancaster County.
Hispanics comprise 5.6% of South Carolina's population. The Hispanic population includes a variety of ethnic groups, of which Mexicans are the largest. Our Hispanic community is represented in every county across our state. Saluda county has the highest percentage with 16%.
There were more South Carolina residents of every race and ethnic group in 2019, compared to 2010, but non-Hispanic white and Black residents account for more than 90 percent of South Carolina's population, compared to less than 73 percent of the U.S. population.
South Carolina DemographicsWhite: 67.16% Black or African American: 26.77% Two or more races: 2.31% Other race: 1.76%
South Carolina DemographicsWhite: 67.16% Black or African American: 26.77% Two or more races: 2.31% Other race: 1.76%