Hawaii Demographic Analysis Worksheet
Description


Get your form ready online
Our built-in tools help you complete, sign, share, and store your documents in one place.
Make edits, fill in missing information, and update formatting in US Legal Forms—just like you would in MS Word.
Download a copy, print it, send it by email, or mail it via USPS—whatever works best for your next step.
Sign and collect signatures with our SignNow integration. Send to multiple recipients, set reminders, and more. Go Premium to unlock E-Sign.
If this form requires notarization, complete it online through a secure video call—no need to meet a notary in person or wait for an appointment.
We protect your documents and personal data by following strict security and privacy standards.
Looking for another form?


How to fill out Demographic Analysis Worksheet?
US Legal Forms - one of the most substantial repositories of legal templates in the United States - offers a variety of legal document formats that you can download or print. By utilizing the website, you can discover numerous templates for business and personal purposes, organized by categories, states, or keywords.
You can quickly find the most recent versions of templates such as the Hawaii Demographic Analysis Worksheet in moments. If you presently hold a subscription, Log In and retrieve the Hawaii Demographic Analysis Worksheet from the US Legal Forms library. The Download button will appear on every document you view. You have access to all previously acquired templates in the My documents section of your account.
If you are planning to use US Legal Forms for the first time, here are simple steps to assist you in getting started: Ensure you have selected the correct document for your location/region. Click the Review button to examine the form's content. Check the information about the form to ensure you have picked the right document.
Each document you add to your account has no expiration date and is yours indefinitely. So, if you wish to download or print another copy, simply go to the My documents section and click on the document you need.
Access the Hawaii Demographic Analysis Worksheet through US Legal Forms, the most extensive library of legal document formats. Utilize numerous professional and state-specific templates that meet your business or personal requirements.
- If the document does not meet your needs, use the Search field at the top of the screen to find one that does.
- If you are satisfied with the form, confirm your selection by clicking the Purchase now button.
- Then, choose your preferred pricing plan and provide your details to create an account.
- Process the payment. Utilize your credit card or PayPal account to complete the transaction.
- Select the format and download the document to your device.
- Make edits. Fill out, modify, print, and sign the downloaded Hawaii Demographic Analysis Worksheet.
Form popularity
FAQ
Right-click on any cell in the table. Select 'Export Table'. Select 'Export to CSV' or 'Export to Excel.
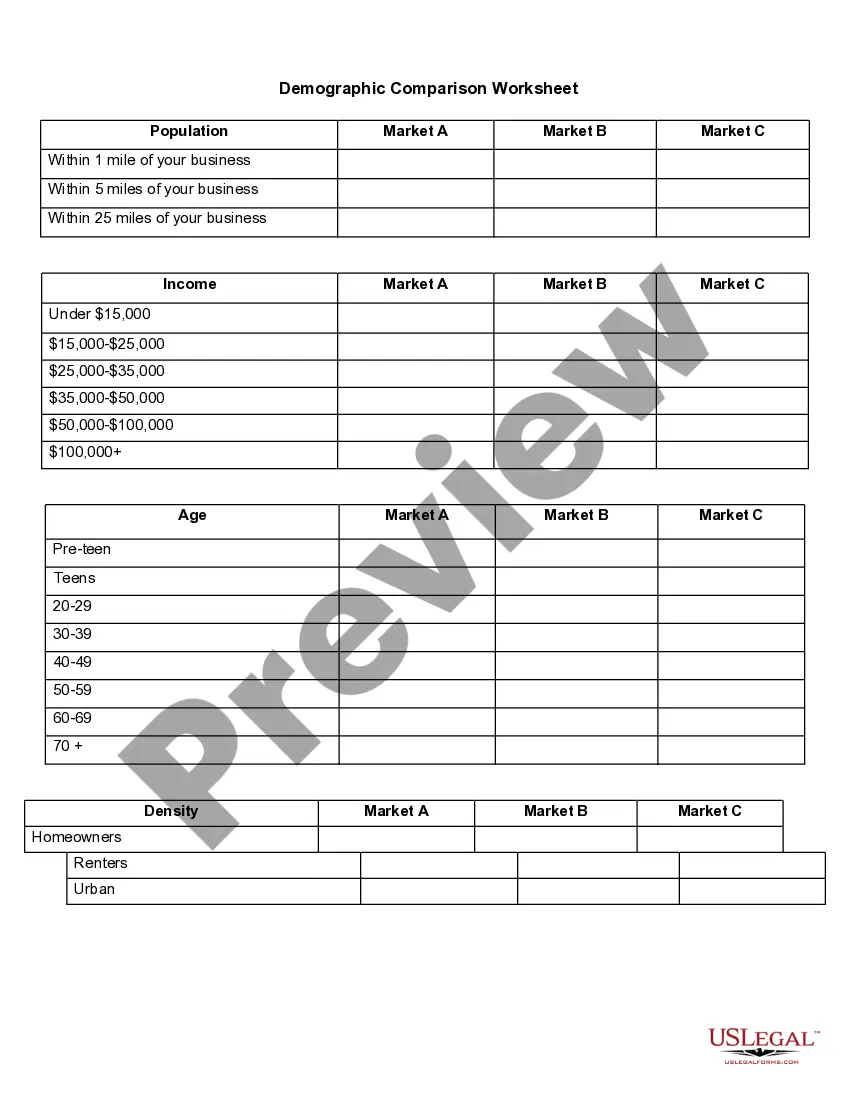
Hawaii DemographicsAsian: 37.79% White: 24.95% Two or more races: 23.89% Native Hawaiian or Pacific Islander: 10.06%
How do I map my Census Tract codes?Open your excel sheet and add a new field (call it Tract Name or something similar)In the first entry in your new column, type the following: =CONCATENATE(C2, TEXT(B2100,"000000"))Click the cell you just created and copy the cell formula to all the rows.
Demographic equation is the mathematical equation which helps determine the change in population over a period of time. It is the number of births minus deaths plus or minus the net migration. The basic demographic equation looks like: Population(t+1) = Populationt + Natural Increaset + Net migrationt.
While many data tables are now available in data.census.gov, you can browse and download additional data tables by topic and year.
Right-click on any cell in the table. Select Export Table. You can either Export to CSV or Export to Excel.
Visit data.census.gov often, and tell us how we can make Census Bureau data easier to access by emailing your comments to cedsci.feedback@census.gov. Issued September 2019 Step 1: Locate the tables that you want. Click on the Download button.
Step 1: Locate the table you want. Select the Download button. Step 2: Check boxes next to the desired Table Vintages. Select the DOWNLOAD button.
We use current and historical vital records, data on international migration, and Medicare records to produce national estimates of the population on April 1 by age, sex, the DA race categories, and Hispanic origin. The DA population estimates are independent of the decennial census.
U.S. Government DataU.S. Bureau of the Census. . Bureau of Labor Statistics. Population Statistics.County Business Patterns.Social Security Administration (Office of Policy)Statistical Abstract of the United States.White House Briefing Room.More items...