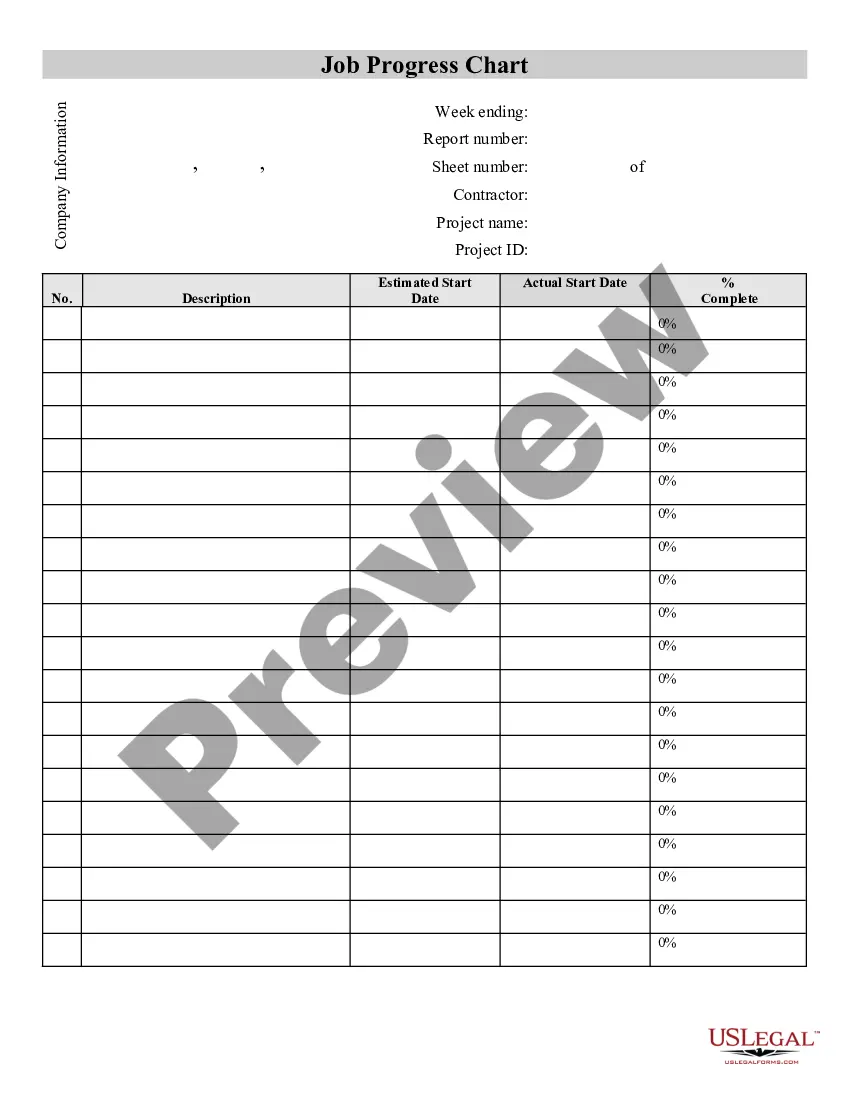
Project Information Sheet Template With Excel
Description


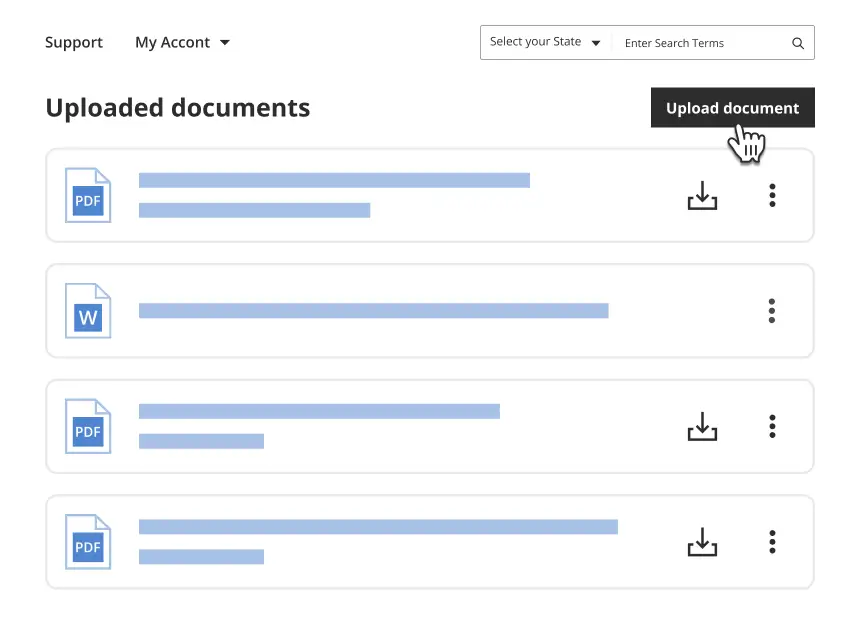
Get your form ready online
Our built-in tools help you complete, sign, share, and store your documents in one place.
Make edits, fill in missing information, and update formatting in US Legal Forms—just like you would in MS Word.
Download a copy, print it, send it by email, or mail it via USPS—whatever works best for your next step.
Sign and collect signatures with our SignNow integration. Send to multiple recipients, set reminders, and more. Go Premium to unlock E-Sign.
If this form requires notarization, complete it online through a secure video call—no need to meet a notary in person or wait for an appointment.
We protect your documents and personal data by following strict security and privacy standards.
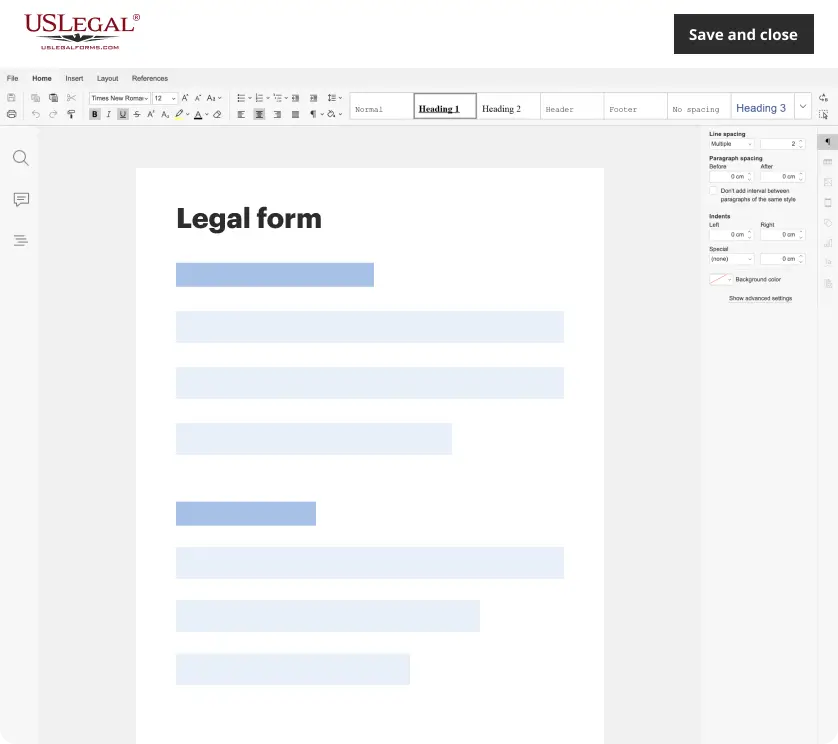
Make edits, fill in missing information, and update formatting in US Legal Forms—just like you would in MS Word.
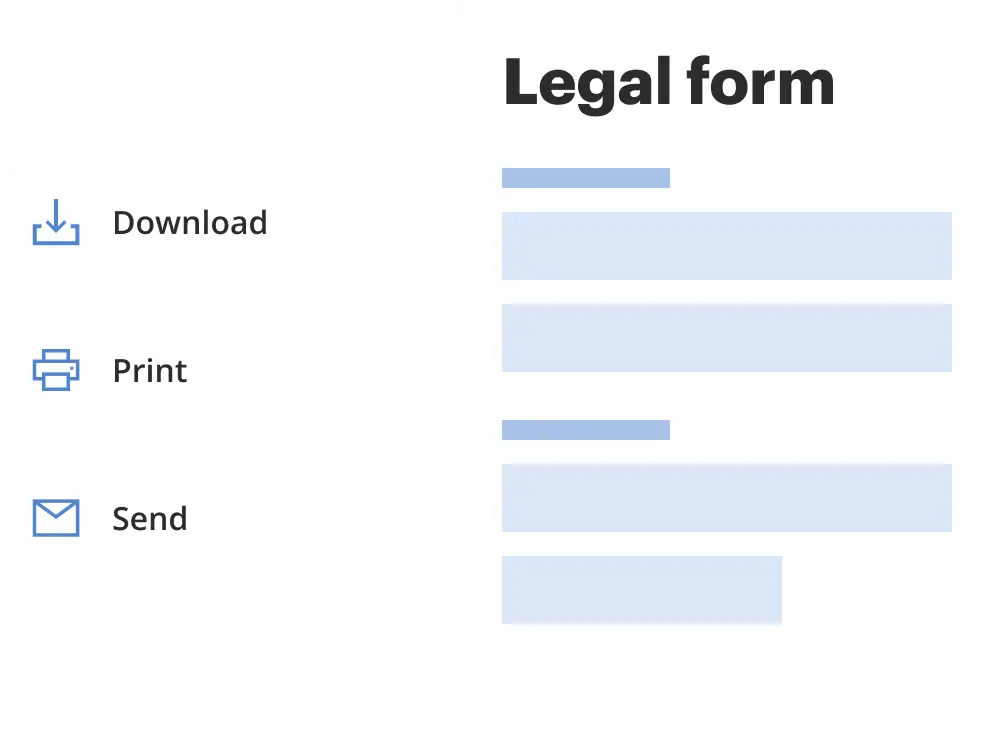
Download a copy, print it, send it by email, or mail it via USPS—whatever works best for your next step.
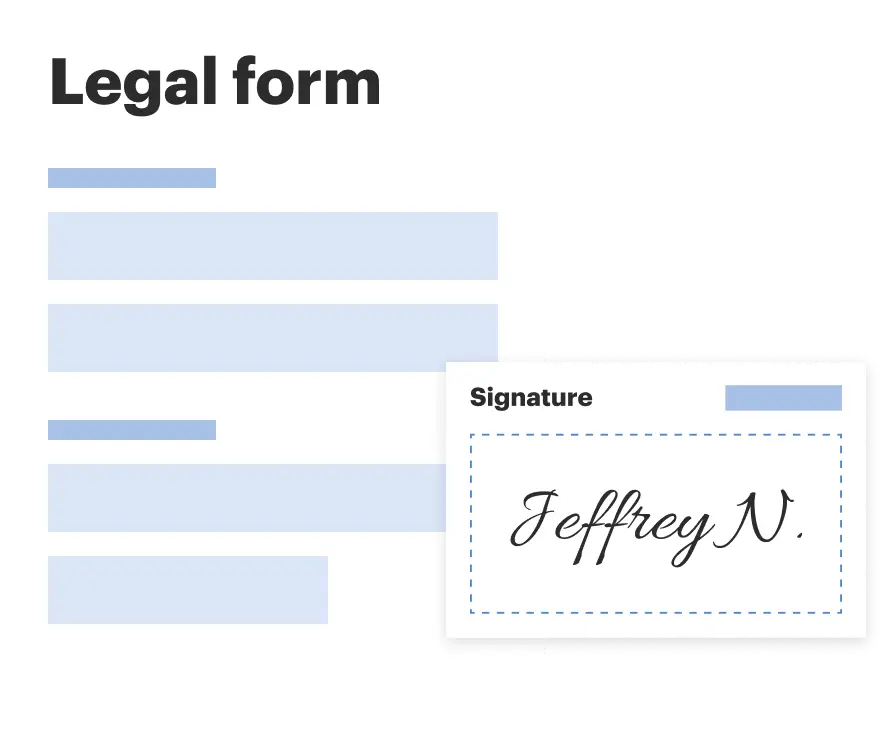
Sign and collect signatures with our SignNow integration. Send to multiple recipients, set reminders, and more. Go Premium to unlock E-Sign.

If this form requires notarization, complete it online through a secure video call—no need to meet a notary in person or wait for an appointment.
We protect your documents and personal data by following strict security and privacy standards.
Looking for another form?

How to fill out Construction Project Information Sheet?
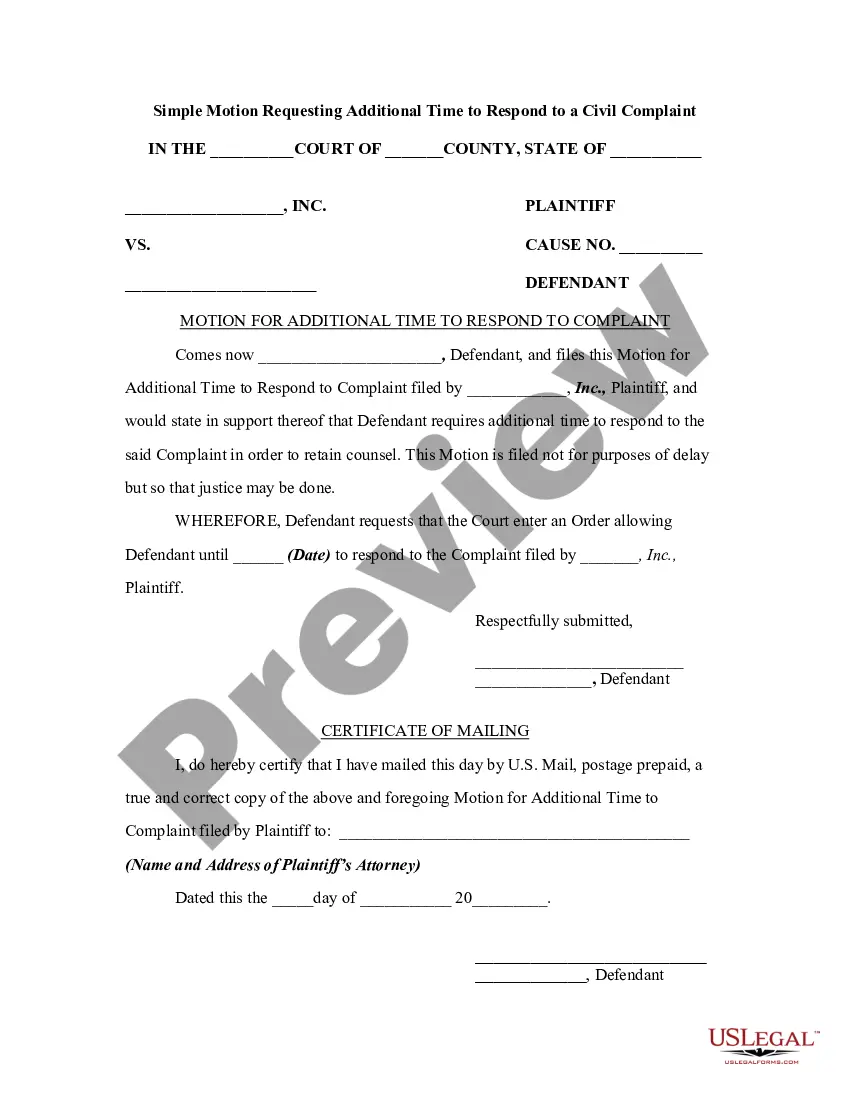
Drafting legal paperwork from scratch can often be a little overwhelming. Certain scenarios might involve hours of research and hundreds of dollars invested. If you’re searching for a more straightforward and more cost-effective way of creating Project Information Sheet Template With Excel or any other documents without the need of jumping through hoops, US Legal Forms is always at your disposal.
Our virtual collection of over 85,000 up-to-date legal documents covers almost every element of your financial, legal, and personal matters. With just a few clicks, you can instantly get state- and county-compliant templates diligently put together for you by our legal specialists.
Use our website whenever you need a trusted and reliable services through which you can easily locate and download the Project Information Sheet Template With Excel. If you’re not new to our services and have previously set up an account with us, simply log in to your account, select the form and download it away or re-download it at any time in the My Forms tab.
Don’t have an account? No problem. It takes little to no time to set it up and explore the library. But before jumping directly to downloading Project Information Sheet Template With Excel, follow these recommendations:
- Review the form preview and descriptions to ensure that you are on the the form you are searching for.
- Make sure the template you select conforms with the requirements of your state and county.
- Pick the best-suited subscription option to buy the Project Information Sheet Template With Excel.
- Download the file. Then fill out, certify, and print it out.
US Legal Forms boasts a spotless reputation and over 25 years of expertise. Join us today and transform document completion into something easy and streamlined!
Form popularity
FAQ
Here's a simple step-by-step guide on how to create a dashboard in Excel. Step 1: Import the necessary data into Excel. No data. ... Step 2: Set up your workbook. ... Step 3: Add raw data to a table. ... Step 4: Data analysis. ... Step 5: Determine the visuals. ... Step 6: Create your Excel dashboard. ... Step 7: Customize your dashboard.
How to create a project plan in Excel Add Headers to the Table. First, you'll need to add some headers to your table. ... Add Your Project Information. Start with the Task column and enter the tasks for your project plan. ... Add Colors to Convey Project Status at a Glance. ... Create the Project Plan Timeline. ... Final Touches.
Excel has a Gantt chart template that can be used for project planning and allows you to manage your project with ease. Similar to Resource Guru's project planning template, Excel's template allows you to enter start dates, the project's duration, and where each task stands in terms of progress.
How do you make a project management dashboard work for you? Determine your KPIs. Choose your KPIs ? the metrics that tell you whether your project is on the track. Identify your data sources. ... Decide how to present each KPI. ... Organize your data. ... Product roadmap. ... Task tracker. ... Financial widget. ... Workload widget.
Microsoft Excel is a handy tool that can do many different things to help you and your project team. And on its good days, Excel can function as a basic project management tool.