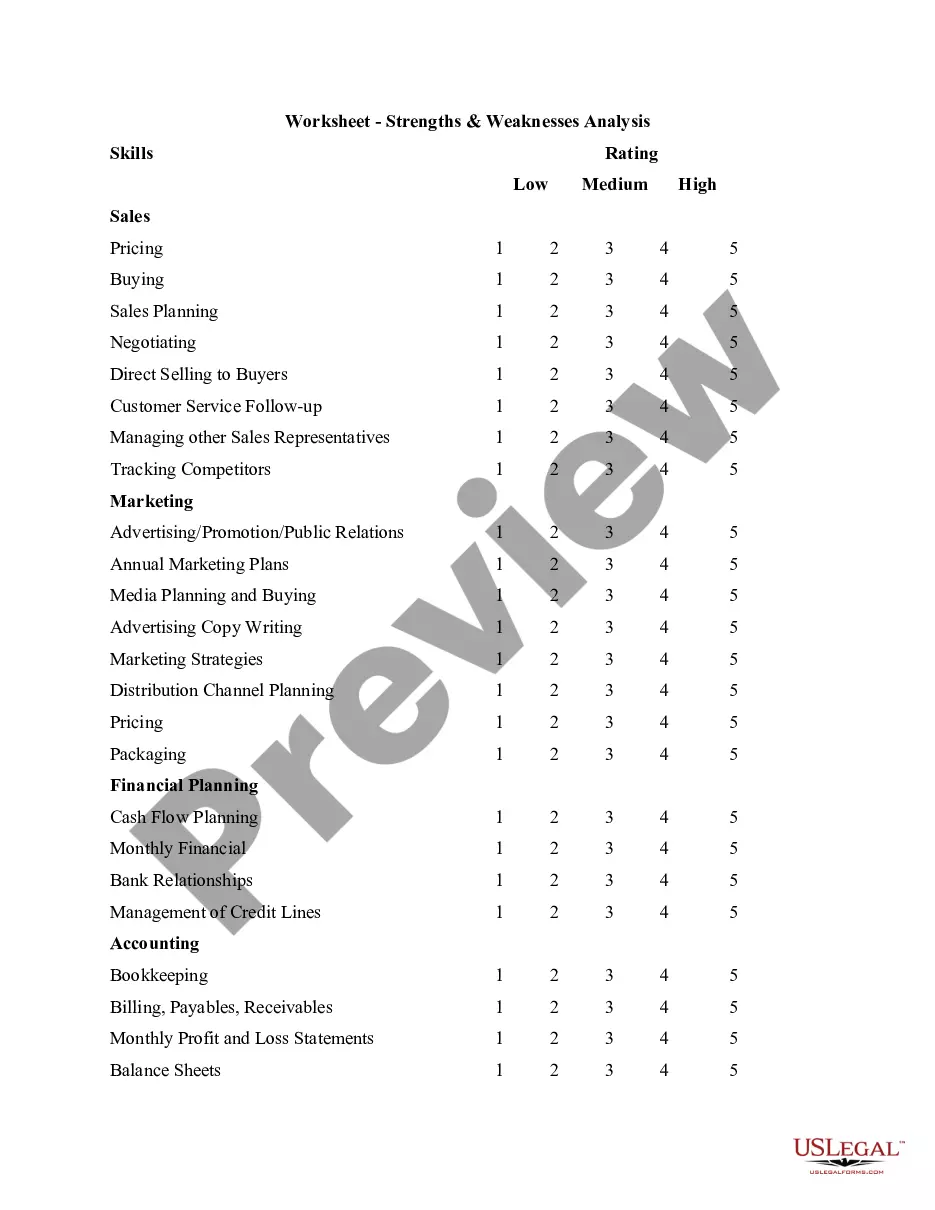
South Dakota Demographic Analysis Worksheet
Description


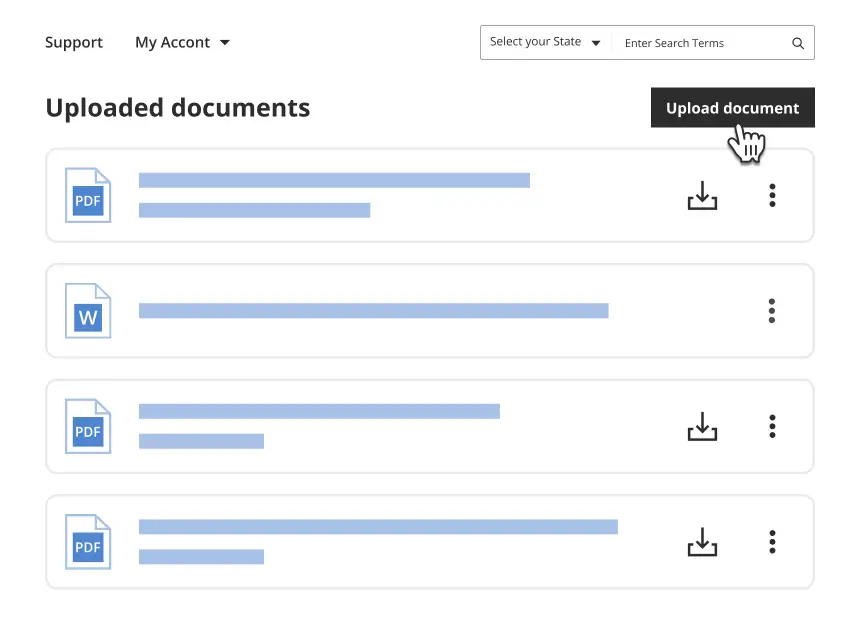
Get your form ready online
Our built-in tools help you complete, sign, share, and store your documents in one place.
Make edits, fill in missing information, and update formatting in US Legal Forms—just like you would in MS Word.
Download a copy, print it, send it by email, or mail it via USPS—whatever works best for your next step.
Sign and collect signatures with our SignNow integration. Send to multiple recipients, set reminders, and more. Go Premium to unlock E-Sign.
If this form requires notarization, complete it online through a secure video call—no need to meet a notary in person or wait for an appointment.
We protect your documents and personal data by following strict security and privacy standards.
Looking for another form?
How to fill out Demographic Analysis Worksheet?
You can dedicate numerous hours online searching for the legal document template that satisfies the federal and state requirements you need.
US Legal Forms provides a vast array of legal forms that are reviewed by experts.
You are able to download or print the South Dakota Demographic Analysis Worksheet from our platform.
If available, use the Preview button to browse through the document template as well.
- If you already have a US Legal Forms account, you may Log In and click the Download button.
- After that, you can complete, modify, print, or sign the South Dakota Demographic Analysis Worksheet.
- Every legal document template you purchase is yours indefinitely.
- To obtain another copy of a purchased form, go to the My documents section and click the relevant button.
- If you are using the US Legal Forms website for the first time, follow the simple instructions below.
- First, make sure you have selected the correct document template for the state/town of your choice.
- Review the form details to ensure you have chosen the right form.
Form popularity
FAQ
An example of demographic information includes the population's age distribution, which indicates the number of individuals within specific age ranges. Other examples are gender ratios, income levels, and educational attainment. You can effectively present such data using the South Dakota Demographic Analysis Worksheet, which facilitates a comprehensive view of demographics.
Sioux Falls DemographicsWhite: 84.49% Black or African American: 6.23% Two or more races: 3.16% Asian: 2.48%
South Dakota is the 46th-most populous U.S. state; in 2019, the U.S. Census Bureau estimated a population of about 884,659. The majority of South Dakotans are White, and the largest religion is Christianity. In 2010, 93.46% of the population spoke English as their primary language.
The 5 largest ethnic groups in South Dakota are White (Non-Hispanic) (81.5%), American Indian & Alaska Native (Non-Hispanic) (8.35%), White (Hispanic) (2.57%), Two+ (Non-Hispanic) (2.55%), and Black or African American (Non-Hispanic) (2.3%).
Demographic Analysis (DA) is a method used to evaluate the quality of the census. We use current and historical vital records, data on international migration, and Medicare records to produce national estimates of the population on April 1 by age, sex, the DA race categories, and Hispanic origin.
South Dakota DemographicsWhite: 84.27% Native American: 8.75% Two or more races: 2.62% Black or African American: 2.01%
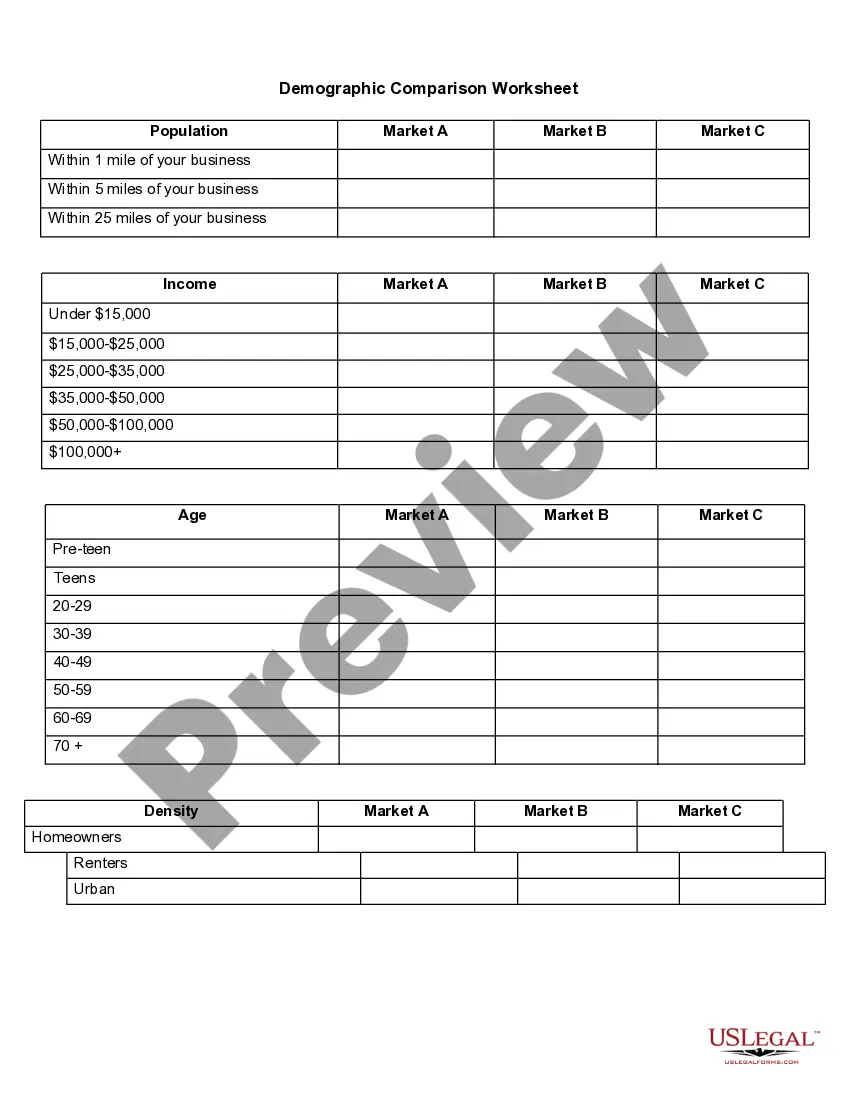
The population density. The distribution of the population by sex/Gender. The distribution of the population by age. The population growth rate.
U.S. Government DataU.S. Bureau of the Census. . Bureau of Labor Statistics. Population Statistics.County Business Patterns.Social Security Administration (Office of Policy)Statistical Abstract of the United States.White House Briefing Room.More items...
9 great tips for an effective demographic questionnaireThink about your survey goal2026 Every survey starts when a goal is set.2026Be mindful of your audience.Know when to get personal.Don't let numbers overlap.Make responses anonymous.Explain the purpose of your survey.Make your survey as accessible as possible.More items...
Demography can be defined as the study of population, typically focused on five aspects: (1) size, (2) geographic distribution, (3) composition, (4) the components of change (births, deaths, migration), and (5) the determinants and consequences of population change (Swanson and Stephan, 2004, p.