Oklahoma Demographic Comparison Worksheet
Description


Get your form ready online
Our built-in tools help you complete, sign, share, and store your documents in one place.
Make edits, fill in missing information, and update formatting in US Legal Forms—just like you would in MS Word.
Download a copy, print it, send it by email, or mail it via USPS—whatever works best for your next step.
Sign and collect signatures with our SignNow integration. Send to multiple recipients, set reminders, and more. Go Premium to unlock E-Sign.
If this form requires notarization, complete it online through a secure video call—no need to meet a notary in person or wait for an appointment.
We protect your documents and personal data by following strict security and privacy standards.
Make edits, fill in missing information, and update formatting in US Legal Forms—just like you would in MS Word.
Download a copy, print it, send it by email, or mail it via USPS—whatever works best for your next step.
Sign and collect signatures with our SignNow integration. Send to multiple recipients, set reminders, and more. Go Premium to unlock E-Sign.

If this form requires notarization, complete it online through a secure video call—no need to meet a notary in person or wait for an appointment.
We protect your documents and personal data by following strict security and privacy standards.
Looking for another form?
How to fill out Demographic Comparison Worksheet?
Selecting the appropriate legal document template can be a challenge.
Indeed, there are numerous templates accessible online, but how can you find the legal form you need.
Utilize the US Legal Forms website.
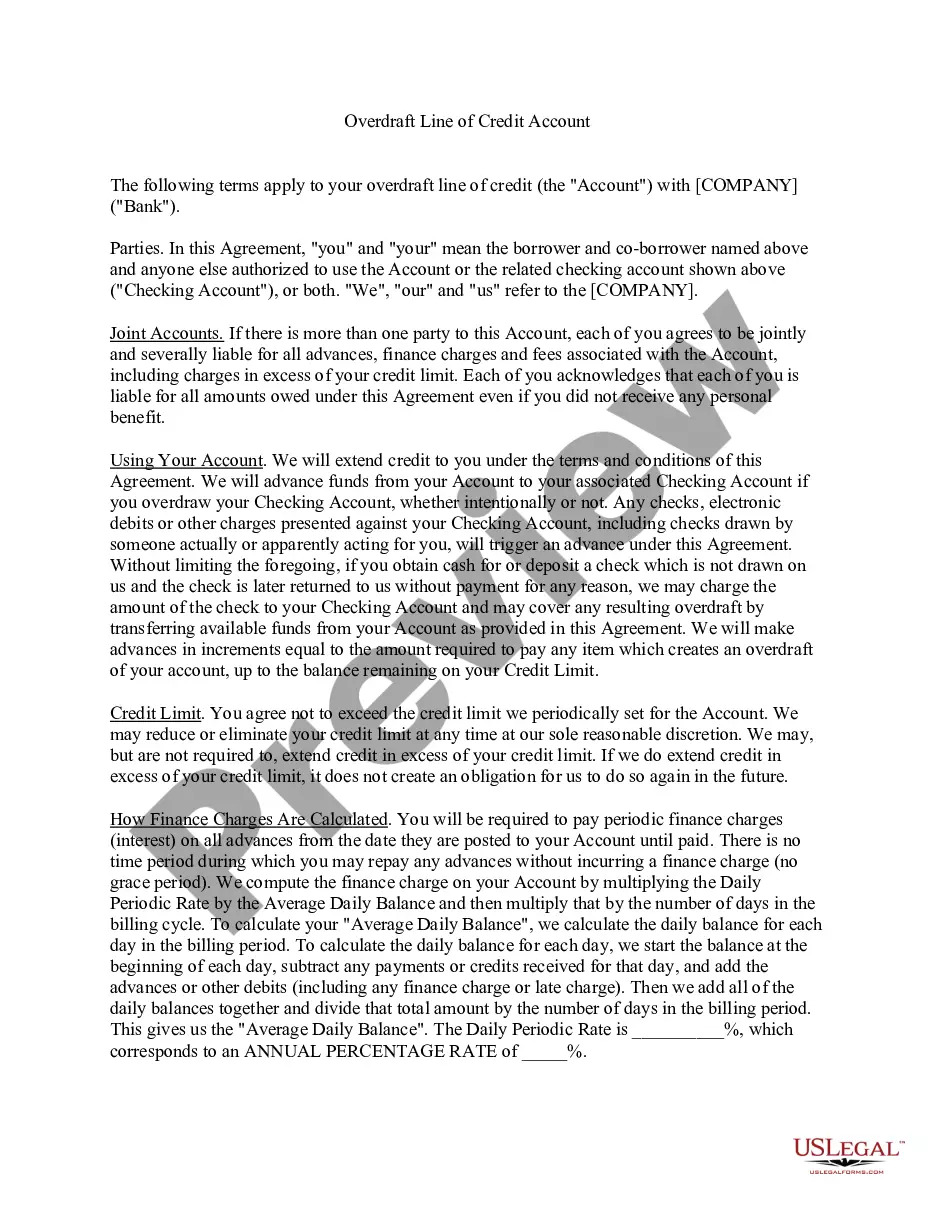
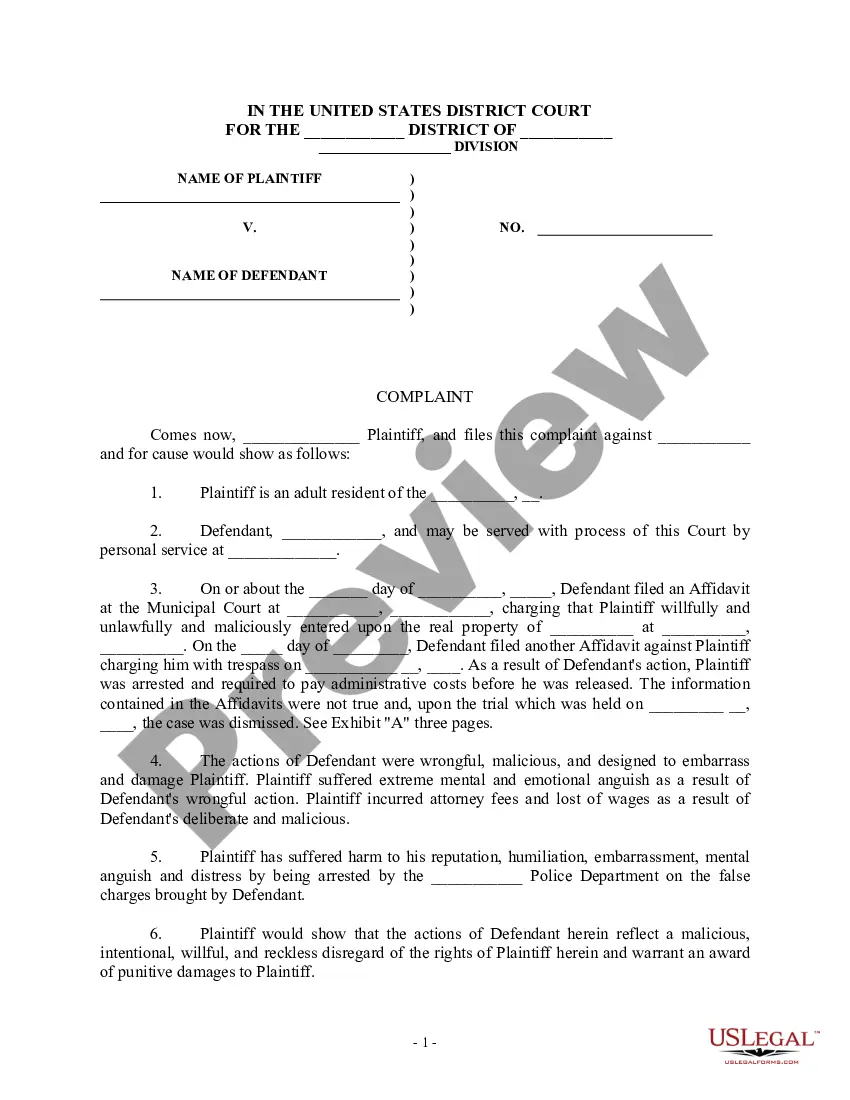
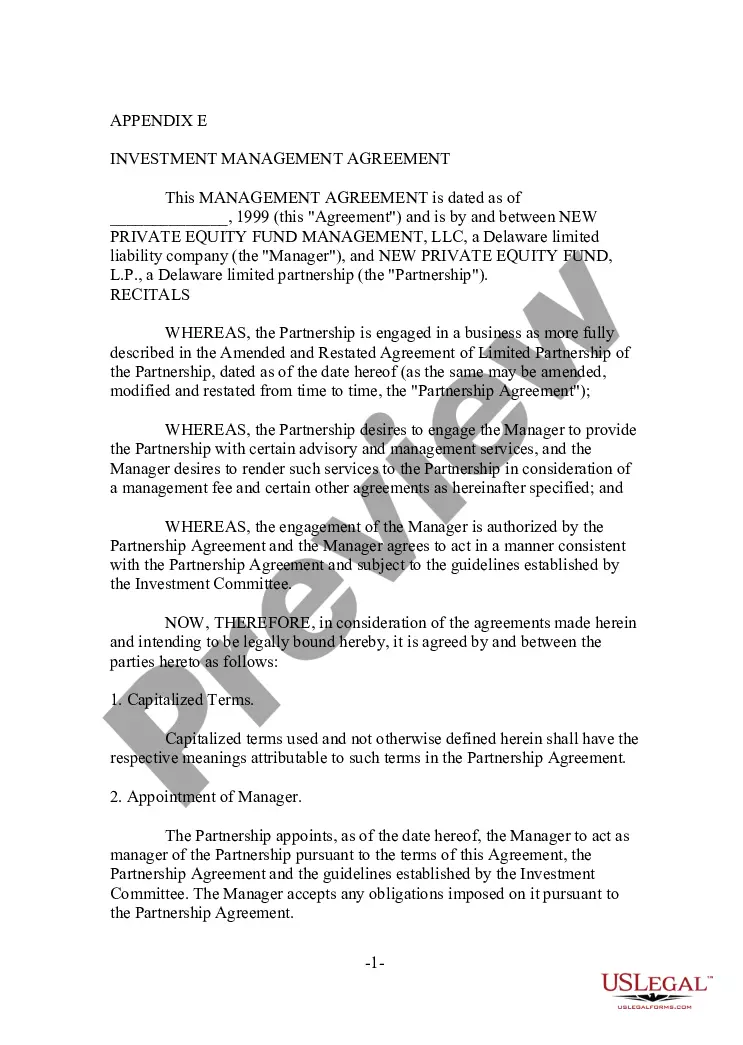
First, ensure you have selected the correct form for your region/area. You can review the form using the Preview button and read the form summary to confirm it is suitable for you.
- The platform offers thousands of templates, including the Oklahoma Demographic Comparison Worksheet, which can be utilized for both business and personal purposes.
- All the forms are reviewed by experts and comply with state and federal requirements.
- If you are already registered, Log In to your account and click the Download button to acquire the Oklahoma Demographic Comparison Worksheet.
- Use your account to search for the legal forms you have purchased previously.
- My documents section of your account offers another copy of the document you need.
- If you are a new user of US Legal Forms, here are simple steps you can follow.
Form popularity
FAQ
Oklahoma County offers a diverse demographic profile that includes various races, age groups, and income levels. You can explore this information through the Oklahoma Demographic Comparison Worksheet, which provides a clear visual representation of these demographics. Understanding the makeup of Oklahoma County can assist businesses, policymakers, and residents in making strategic decisions. It's a vital resource for anyone looking to engage with the community effectively.
Oklahoma DemographicsWhite: 72.32% Two or more races: 7.75% Native American: 7.62% Black or African American: 7.28%
Hispanic population in Oklahoma are 394,879. Percentage wise 10.13 percent are hispanics, out of these 323,876 are Mexican people, 13,612 are Puerto Ricans, 2,921 are Cubans, and 54,470 are other Hispanic or Latinos. Hispanics may be of any race, included in applicable race categories.
Oklahoma Demographics White: 72.32% Two or more races: 7.75% Native American: 7.62%
The percentage of people whose race is Black or African American was 7.8% in the 2019 census. Those who are American Indian or Alaska Native made up 9.4% of the population.
White American: 62.6% (57.9% Non-Hispanic Whites) African American: 15.6% Native American: 5.3% Asian American: 2.3% (0.5% Indian, 0.4% Vietnamese, 0.3% Chinese, 0.2% Hmong, 0.2% Korean, 0.2% Burmese)
According to 2017 demographics estimates population of Oklahoma by race are, 72.6% are White Americans, 7.3% are Black Americans, 10.1% are Hispanic/Latino's, 7.5% are American Indian and Alaska Natives(AIAN), 2% are Asians and around 0.1% are NHPI.
Oklahoma City Demographics According to the most recent ACS, the racial composition of Oklahoma Citywas: White: 67.68% Black or African American: 14.28% Two or more races: 6.34%
Oklahoma DemographicsWhite: 72.32% Two or more races: 7.75% Native American: 7.62% Black or African American: 7.28%
The 5 largest ethnic groups in Oklahoma are White (Non-Hispanic) (64.9%), American Indian & Alaska Native (Non-Hispanic) (7.66%), White (Hispanic) (7.53%), Black or African American (Non-Hispanic) (7.11%), and Two+ (Non-Hispanic) (6.84%).