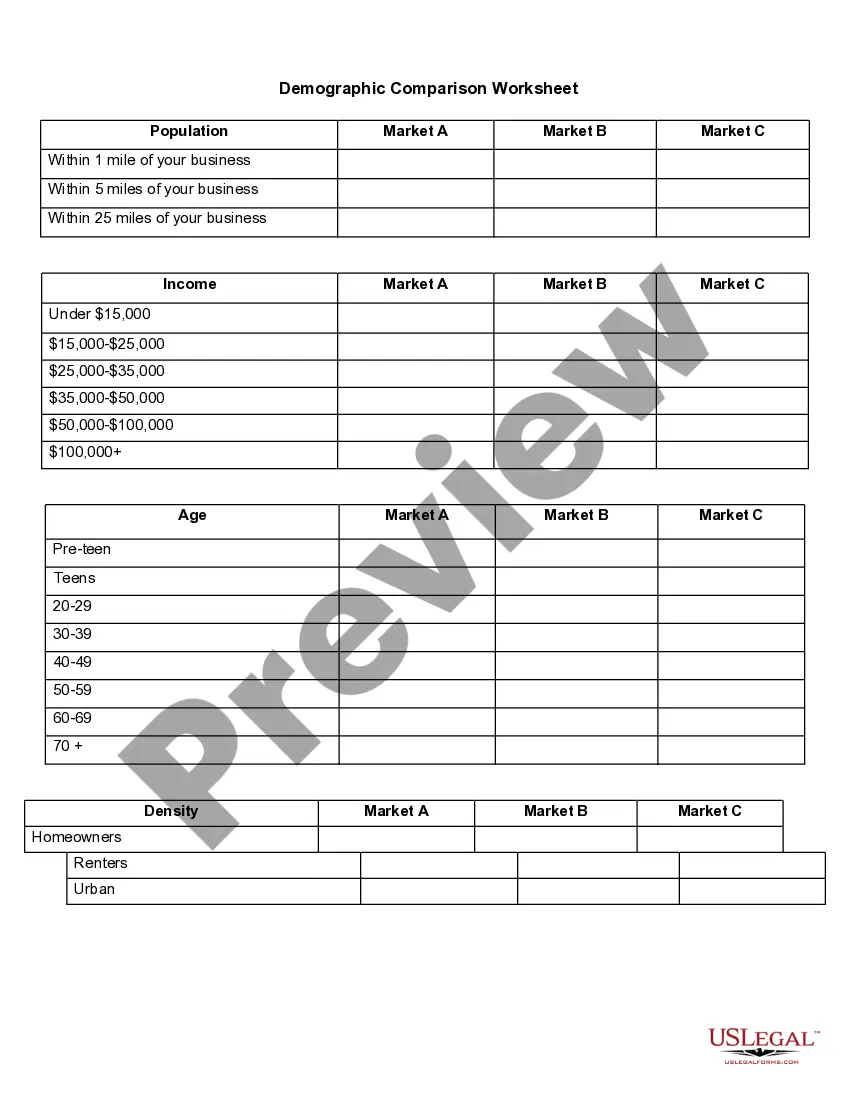
Nebraska Demographic Comparison Worksheet
Description
Get your form ready online
Our built-in tools help you complete, sign, share, and store your documents in one place.
Make edits, fill in missing information, and update formatting in US Legal Forms—just like you would in MS Word.
Download a copy, print it, send it by email, or mail it via USPS—whatever works best for your next step.
Sign and collect signatures with our SignNow integration. Send to multiple recipients, set reminders, and more. Go Premium to unlock E-Sign.
If this form requires notarization, complete it online through a secure video call—no need to meet a notary in person or wait for an appointment.
We protect your documents and personal data by following strict security and privacy standards.
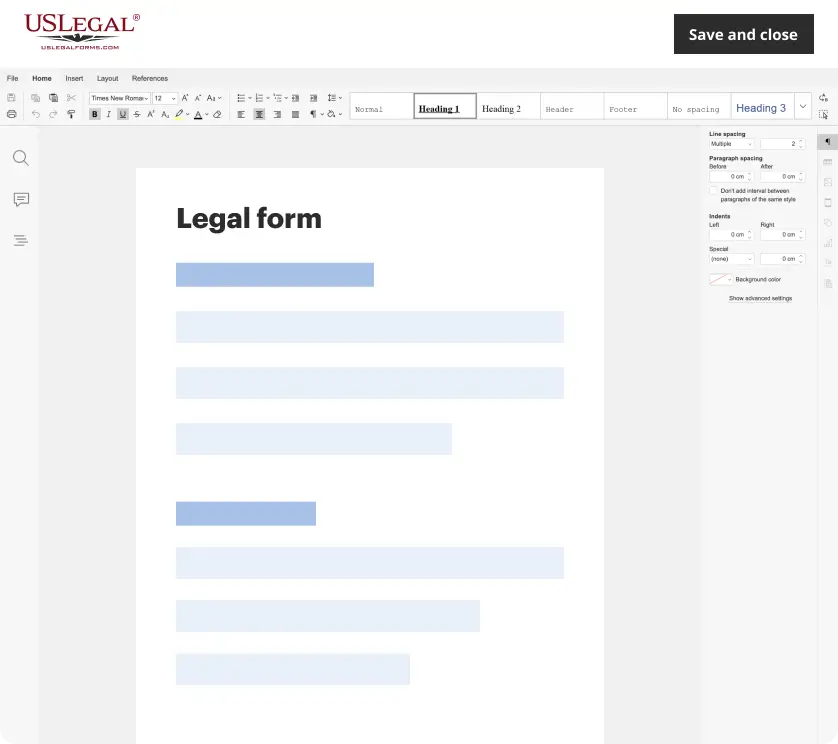
Make edits, fill in missing information, and update formatting in US Legal Forms—just like you would in MS Word.
Download a copy, print it, send it by email, or mail it via USPS—whatever works best for your next step.
Sign and collect signatures with our SignNow integration. Send to multiple recipients, set reminders, and more. Go Premium to unlock E-Sign.
If this form requires notarization, complete it online through a secure video call—no need to meet a notary in person or wait for an appointment.
We protect your documents and personal data by following strict security and privacy standards.
Looking for another form?
How to fill out Demographic Comparison Worksheet?
You might spend multiple hours online searching for the official document template that fits the state and federal requirements you have.
US Legal Forms provides a vast array of legal templates that can be reviewed by professionals.
You can obtain or print the Nebraska Demographic Comparison Worksheet from my services.
If available, use the Review option to examine the document template as well.
- If you already have a US Legal Forms account, you can Log In and select the Acquire option.
- Then, you can complete, modify, print, or sign the Nebraska Demographic Comparison Worksheet.
- Every legal document template you obtain is yours permanently.
- To download another copy of a purchased form, go to the My documents tab and select the appropriate option.
- If you're using the US Legal Forms site for the first time, follow the basic instructions below.
- First, ensure you've chosen the correct document template for the region/area of your choice.
- Check the form description to confirm you've selected the right form.
Form popularity
FAQ
The Hispanic population in Nebraska is the 35th largest in the nation. About 190,000 Hispanics reside in Nebraska, 0.3% of all Hispanics in the United States. Nebraska's population is 10% Hispanic, the 20th largest Hispanic statewide population share nationally.
Nebraska DemographicsWhite: 87.06% Black or African American: 4.83% Two or more races: 2.63% Asian: 2.38%
According to the U.S. Census Bureau, the 2017 Nebraska population was estimated at 1,929,268. Approximately 79% of the population was White. Almost 5% of the population was African American, approximately 1% was American Indian, 2.6% of the population was Asian, and 2.3% were more than one race.
According to the U.S. Census Bureau, the 2017 Nebraska population was estimated at 1,929,268. Approximately 79% of the population was White. Almost 5% of the population was African American, approximately 1% was American Indian, 2.6% of the population was Asian, and 2.3% were more than one race.
Nebraska DemographicsWhite: 87.06% Black or African American: 4.83% Two or more races: 2.63% Asian: 2.38%
The 5 largest ethnic groups in Omaha, NE are White (Non-Hispanic) (65.8%), Black or African American (Non-Hispanic) (12.8%), White (Hispanic) (11.1%), Asian (Non-Hispanic) (4.08%), and Two+ (Non-Hispanic) (2.89%). 0% of the households in Omaha, NE speak a non-English language at home as their primary language.
The 5 largest ethnic groups in the United States are White (Non-Hispanic) (60%), Black or African American (Non-Hispanic) (12.4%), White (Hispanic) (12.1%), Asian (Non-Hispanic) (5.61%), and Other (Hispanic) (4.73%).
The 5 largest ethnic groups in Nebraska are White (Non-Hispanic) (78.4%), White (Hispanic) (7.81%), Black or African American (Non-Hispanic) (4.76%), Other (Hispanic) (2.58%), and Asian (Non-Hispanic) (2.45%).