Maryland Demographic Analysis Worksheet
Description


Get your form ready online
Our built-in tools help you complete, sign, share, and store your documents in one place.
Make edits, fill in missing information, and update formatting in US Legal Forms—just like you would in MS Word.
Download a copy, print it, send it by email, or mail it via USPS—whatever works best for your next step.
Sign and collect signatures with our SignNow integration. Send to multiple recipients, set reminders, and more. Go Premium to unlock E-Sign.
If this form requires notarization, complete it online through a secure video call—no need to meet a notary in person or wait for an appointment.
We protect your documents and personal data by following strict security and privacy standards.
Make edits, fill in missing information, and update formatting in US Legal Forms—just like you would in MS Word.
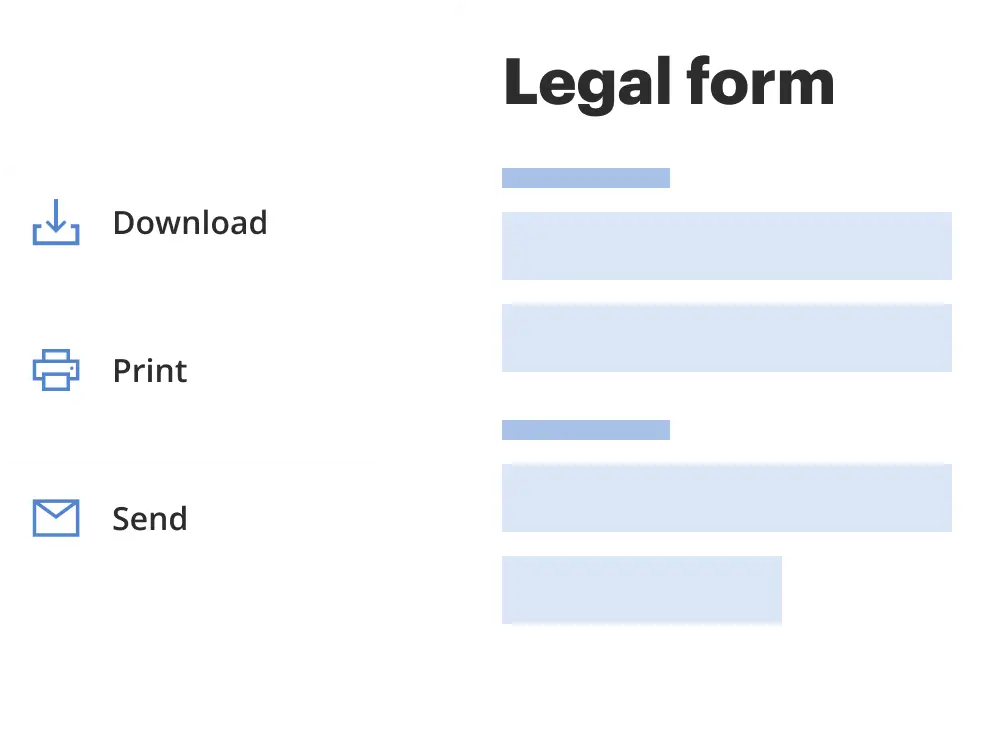
Download a copy, print it, send it by email, or mail it via USPS—whatever works best for your next step.
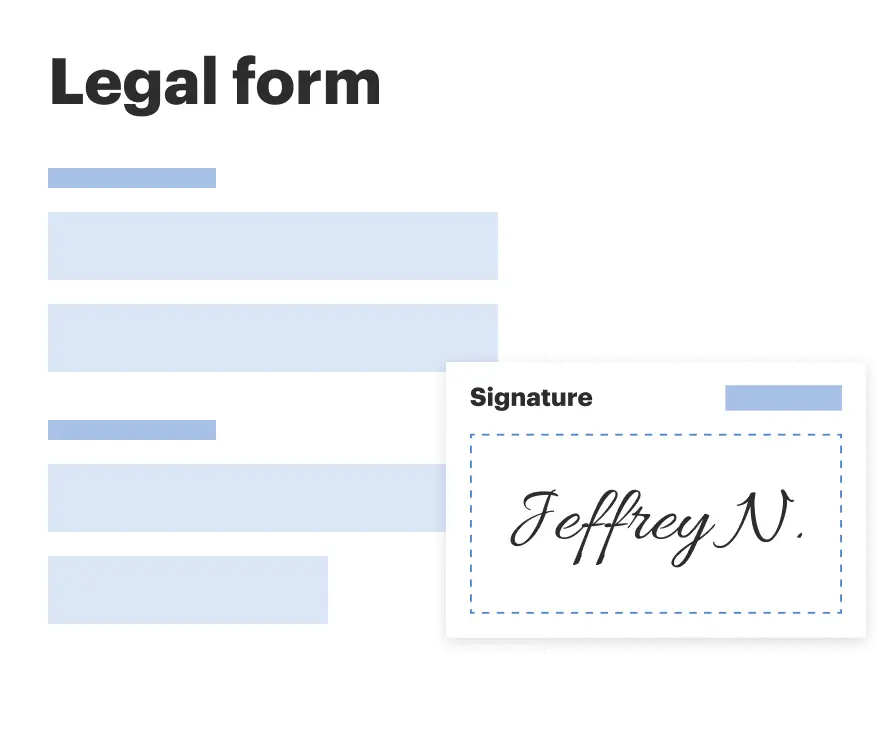
Sign and collect signatures with our SignNow integration. Send to multiple recipients, set reminders, and more. Go Premium to unlock E-Sign.
If this form requires notarization, complete it online through a secure video call—no need to meet a notary in person or wait for an appointment.
We protect your documents and personal data by following strict security and privacy standards.
Looking for another form?

How to fill out Demographic Analysis Worksheet?
Are you in the location where you will require documents for either business or personal activities nearly every workday.
There are numerous legitimate document templates available online, but finding versions you can rely on isn’t straightforward.
US Legal Forms provides thousands of draft templates, such as the Maryland Demographic Analysis Worksheet, which can be tailored to meet national and state regulations.
Access all the document templates you have purchased in the My documents section.
You can obtain an additional copy of the Maryland Demographic Analysis Worksheet at any time, if necessary. Just click on the required document to download or print the template.
Utilize US Legal Forms, the most extensive selection of legal documents, to save time and prevent mistakes.
The service offers properly formulated legal document templates that can be used for a variety of purposes.
Create an account on US Legal Forms and start making your life a bit easier.
- If you are already familiar with the US Legal Forms portal and have an account, simply Log In.
- After that, you can download the Maryland Demographic Analysis Worksheet template.
- If you do not have an account and wish to start using US Legal Forms, follow these steps.
- Locate the document you need and ensure it is for the correct city/county.
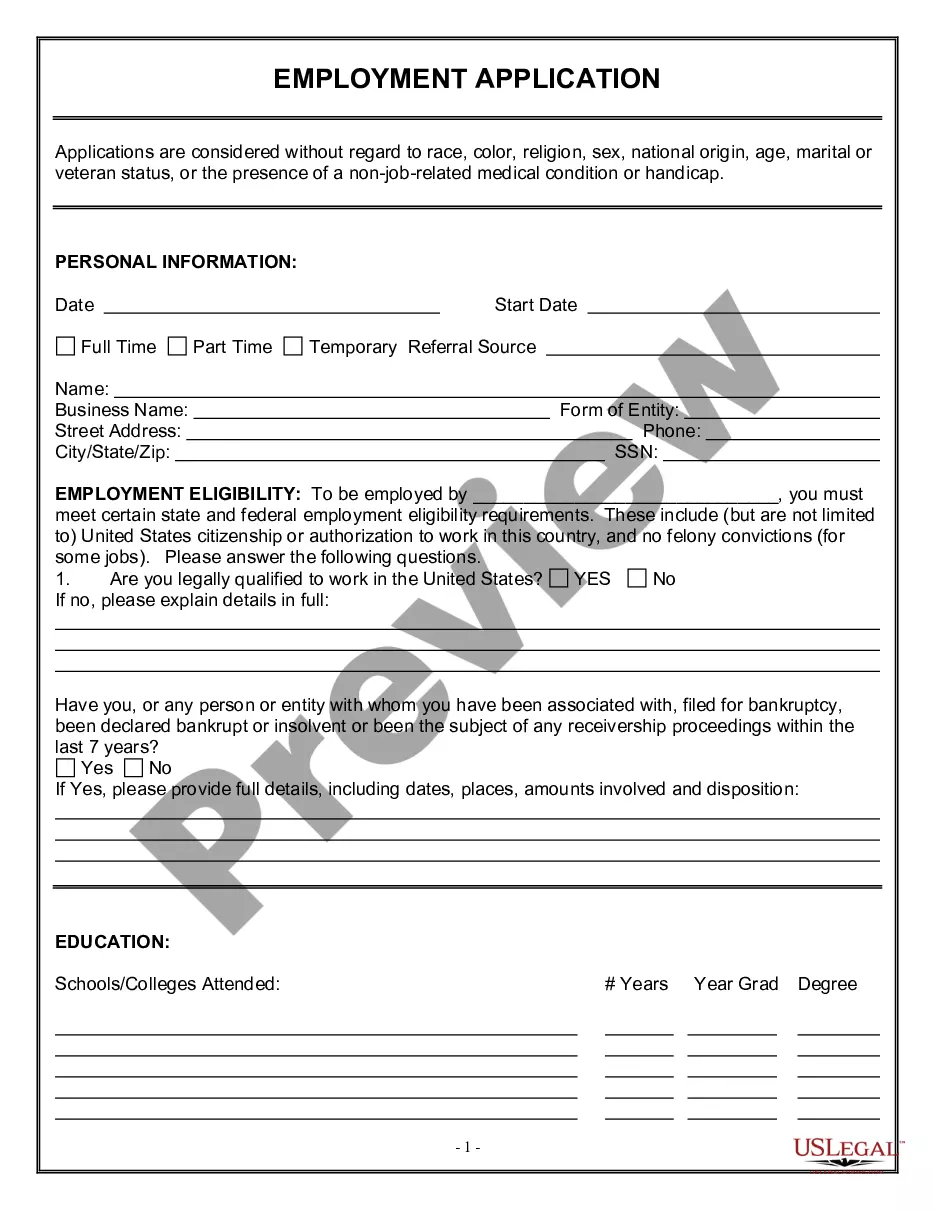
- Use the Preview feature to review the form.
- Check the description to ensure you have chosen the right document.
- If the document isn’t what you are looking for, utilize the Lookup section to find the document that suits your needs.
- Once you find the correct document, simply click Acquire now.
- Select the pricing plan you prefer, provide the required information to create your account, and pay for the order using PayPal or a credit card.
- Select a convenient file format and download your copy.
Form popularity
FAQ
Use the following steps to create a population pyramid in Excel.Step 1: Input the data. First, input the population counts (by age bracket) for males and females in separate columns:Step 2: Calculate the percentages.Step 3: Insert a 2-D Stacked Bar Chart.Step 4: Modify the appearance of the population pyramid.
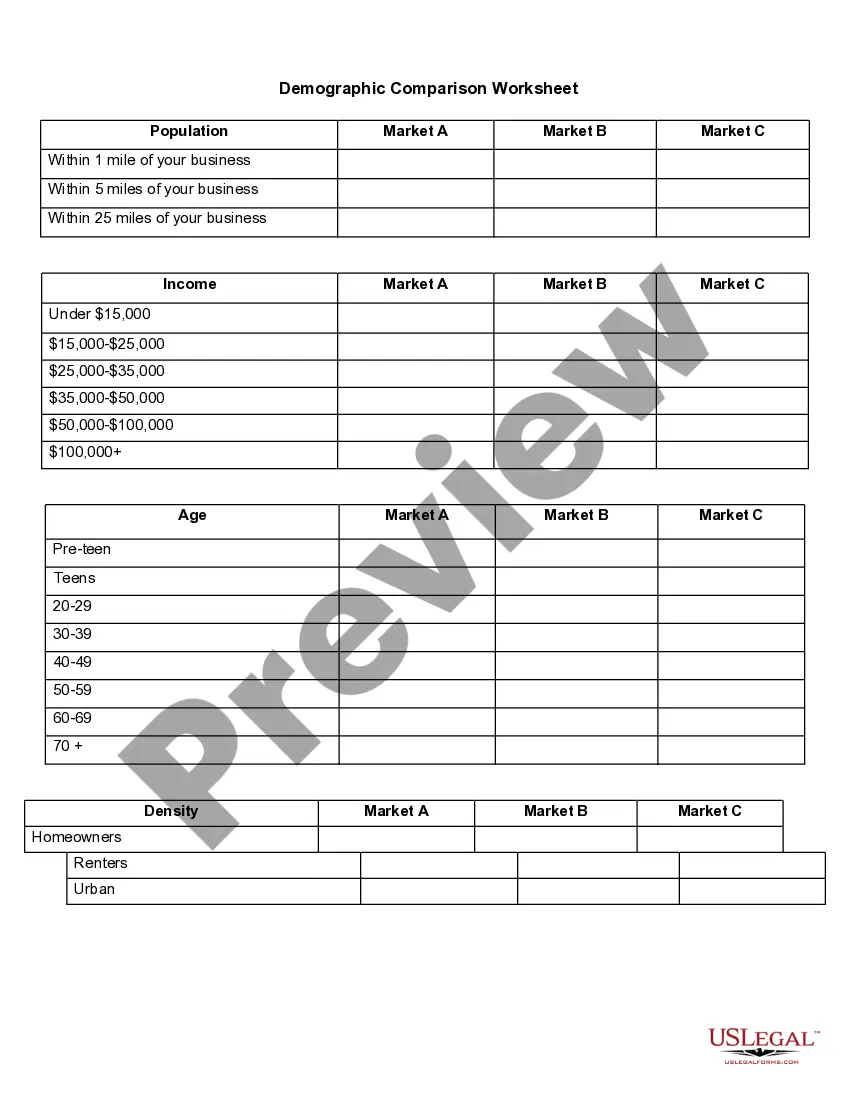
Demographic analysis is the study of a population-based on factors such as age, race, and sex. Demographic data refers to socioeconomic information expressed statistically, including employment, education, income, marriage rates, birth and death rates, and more.
9 great tips for an effective demographic questionnaireThink about your survey goal2026 Every survey starts when a goal is set.2026Be mindful of your audience.Know when to get personal.Don't let numbers overlap.Make responses anonymous.Explain the purpose of your survey.Make your survey as accessible as possible.More items...
Divide the target demographic by the entire population, and then multiply the result by 100 to convert it to a percentage.
On the top of the Excel tool bar, choose the Data tab. Then, click the sort function (circled below in blue). In the window that pops up, click Sort by 'Diagnosis. ' To sort again by gender, click the button in the upper-left corner of the window that says Add Level. Then, click Gender and the OK button.
A demographic refers to distinct characteristics of a population. Researchers use demographic analysis to analyze whole societies or just groups of people. Some examples of demographics are age, sex, education, nationality, ethnicity, or religion, to name a few.
Divide the target demographic by the entire population, and then multiply the result by 100 to convert it to a percentage.
Maryland DemographicsWhite: 55.54% Black or African American: 29.89% Asian: 6.28% Other race: 4.52%
In excel go to Tools -- Data Analysis. If you do not see "data analysis" option you need to install it, go to Tools -- Add-Ins, a window will pop-up and check the "Analysis ToolPack" option, then press OK. Try running data analysis again. In the pop-up window select "Descriptive Statistics" click OK.
In excel go to Tools -- Data Analysis. If you do not see "data analysis" option you need to install it, go to Tools -- Add-Ins, a window will pop-up and check the "Analysis ToolPack" option, then press OK. Try running data analysis again. In the pop-up window select "Descriptive Statistics" click OK.