Indiana Demographic Comparison Worksheet
Description


Get your form ready online
Our built-in tools help you complete, sign, share, and store your documents in one place.
Make edits, fill in missing information, and update formatting in US Legal Forms—just like you would in MS Word.
Download a copy, print it, send it by email, or mail it via USPS—whatever works best for your next step.
Sign and collect signatures with our SignNow integration. Send to multiple recipients, set reminders, and more. Go Premium to unlock E-Sign.
If this form requires notarization, complete it online through a secure video call—no need to meet a notary in person or wait for an appointment.
We protect your documents and personal data by following strict security and privacy standards.
Make edits, fill in missing information, and update formatting in US Legal Forms—just like you would in MS Word.
Download a copy, print it, send it by email, or mail it via USPS—whatever works best for your next step.
Sign and collect signatures with our SignNow integration. Send to multiple recipients, set reminders, and more. Go Premium to unlock E-Sign.

If this form requires notarization, complete it online through a secure video call—no need to meet a notary in person or wait for an appointment.
We protect your documents and personal data by following strict security and privacy standards.
Looking for another form?
How to fill out Demographic Comparison Worksheet?
US Legal Forms - one of the most prominent collections of legal documents in the United States - provides a variety of legal document templates that you can download or print. By utilizing the website, you can find thousands of templates for business and personal use, organized by categories, states, or keywords.
You can access the latest versions of forms such as the Indiana Demographic Comparison Worksheet in a matter of minutes.
If you own a subscription, Log In and download the Indiana Demographic Comparison Worksheet from the US Legal Forms library. The Download option will appear on every form you view. You have access to all previously downloaded forms in the My documents tab of your account.
Every template you added to your account has no expiration date and is yours indefinitely. Therefore, if you need to download or print another copy, simply navigate to the My documents section and click on the form you require.
Access the Indiana Demographic Comparison Worksheet with US Legal Forms, the most extensive collection of legal document templates. Utilize thousands of expert and state-specific templates that meet your business or personal needs.
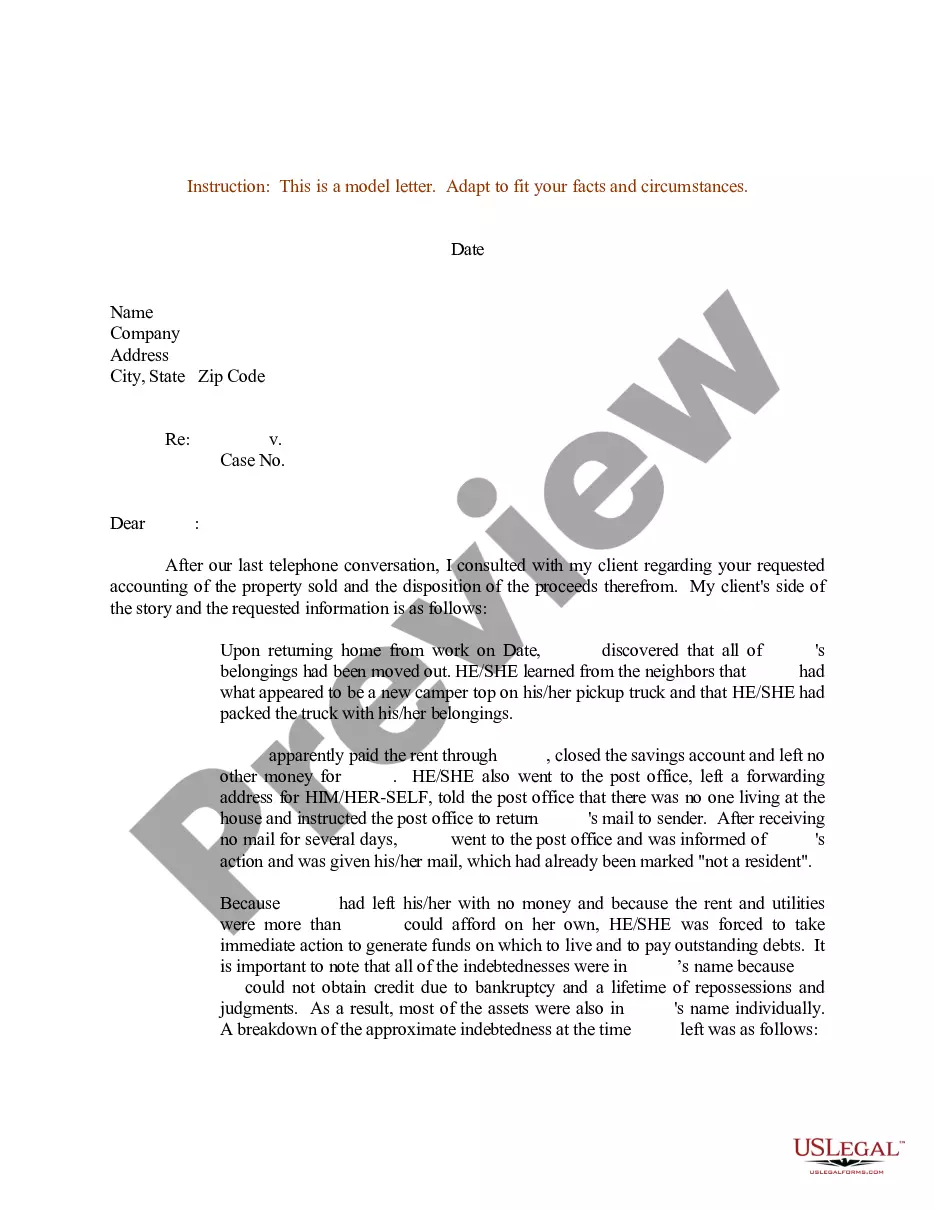
- Ensure you have selected the correct form for your region/county. Click the Preview button to check the details of the form. Review the form description to confirm that you have chosen the right template.
- If the form does not meet your requirements, use the Search feature at the top of the screen to find one that does.
- If you are satisfied with the form, confirm your selection by clicking the Get now option. Then, choose your preferred pricing plan and provide your credentials to create an account.
- Process the payment. Use your credit card or PayPal account to complete the transaction.
- Select the file format and download the form to your device.
- Make modifications. Complete, edit, print, and sign the downloaded Indiana Demographic Comparison Worksheet.
Form popularity
FAQ
For a complete definition for each racial and ethnic category see Appendix A. The majority of Indiana's population is white (88.7%), followed by African-Americans (8.8%), Asian-Americans (1.2%) and American Indians and Alaska Natives (0.3%).
The majority of Indiana's population is white (88.7%), followed by African-Americans (8.8%), Asian-Americans (1.2%) and American Indians and Alaska Natives (0.3%). The state's population is overwhelmingly Non-Hispanic (95.5%) with a small, but growing, Hispanic minority (4.5%).
Indianapolis DemographicsWhite: 60.90% Black or African American: 28.55% Other race: 3.47% Asian: 3.43%
Looking at total population counts by race and ethnic group, the majority of Indiana's 6.8 million residents are white (5.12 million), followed by Black (637,500), Hispanic (554,191), multi-race (265,344), Asian (166,651), American Indian or Alaska Native (12,938), and Native Hawaiian or other Pacific Islander (2,761).
Looking at total population counts by race and ethnic group, the majority of Indiana's 6.8 million residents are white (5.12 million), followed by Black (637,500), Hispanic (554,191), multi-race (265,344), Asian (166,651), American Indian or Alaska Native (12,938), and Native Hawaiian or other Pacific Islander (2,761).
While the percentage of the white population continues to decrease, in 2019 the actual number of white residents in Indianapolis increased significantly. The total count reached 526,643, rising by 4%, after dropping from 554,423 to 507,005 between 1990 and 2010, according to 2019 ACS five-year estimates.
In 2021, about 6.81 million people lived in Indiana. This was an increase from the previous year, when about 6.79 million people lived in the state. In 1960, the resident population of Indiana was about 4.66 million people.
The population of World in 2021 was 7,874,965,825, a 1.03% increase from 2020. The population of World in 2020 was 7,794,798,739, a 1.05% increase from 2019. The population of World in 2019 was 7,713,468,100, a 1.08% increase from 2018.
In 2021, about 6.81 million people lived in Indiana. This was an increase from the previous year, when about 6.79 million people lived in the state. In 1960, the resident population of Indiana was about 4.66 million people.
Looking at total population counts by race and ethnic group, the majority of Indiana's 6.8 million residents are white (5.12 million), followed by Black (637,500), Hispanic (554,191), multi-race (265,344), Asian (166,651), American Indian or Alaska Native (12,938), and Native Hawaiian or other Pacific Islander (2,761).