Arizona Demographic Comparison Worksheet
Description


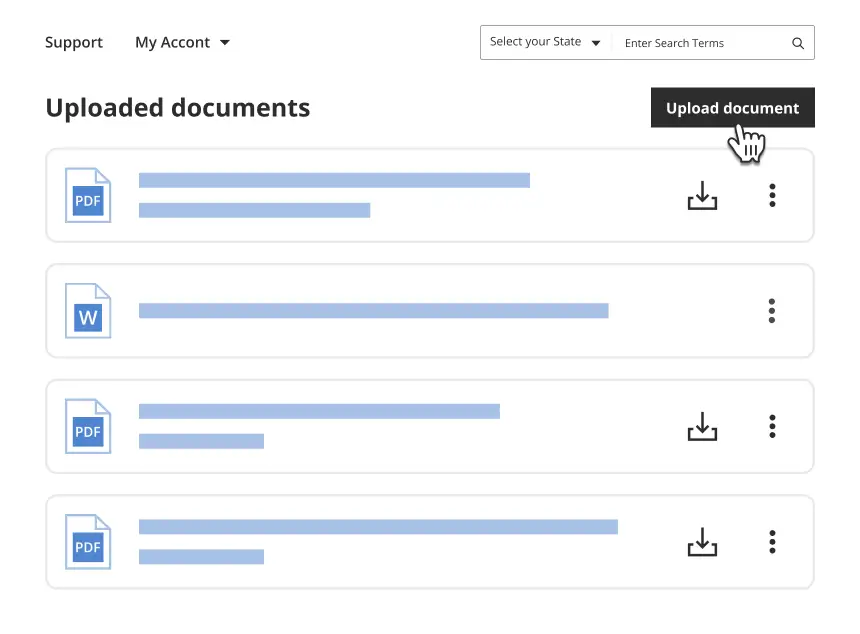
Get your form ready online
Our built-in tools help you complete, sign, share, and store your documents in one place.
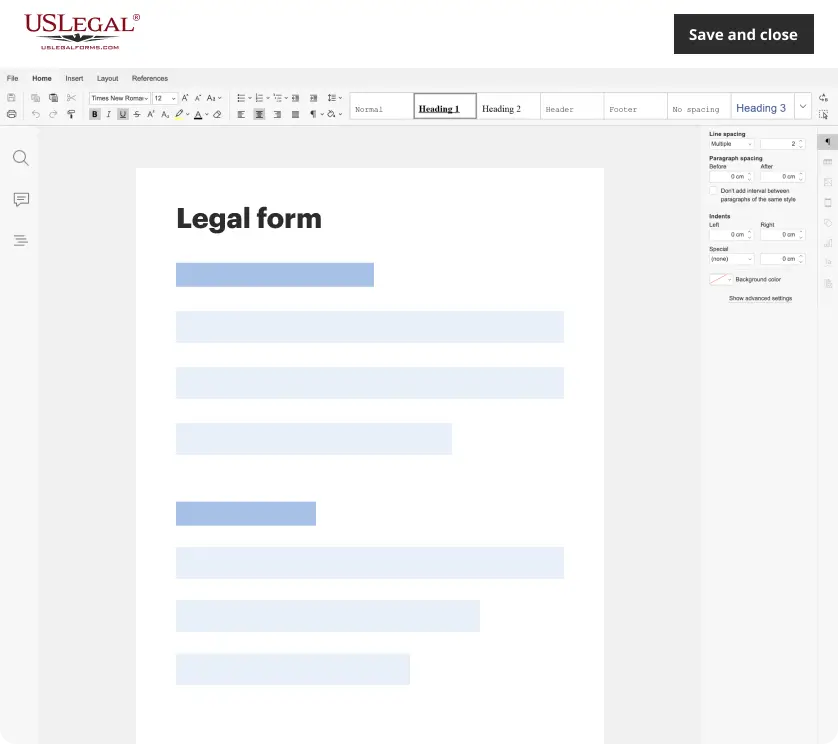
Make edits, fill in missing information, and update formatting in US Legal Forms—just like you would in MS Word.
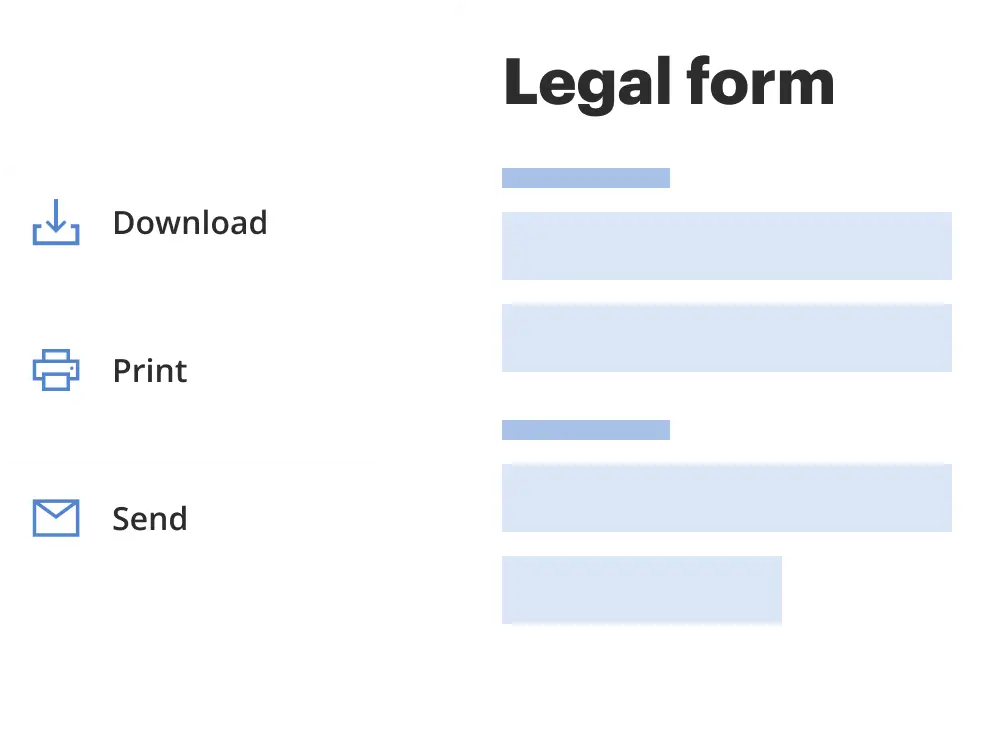
Download a copy, print it, send it by email, or mail it via USPS—whatever works best for your next step.
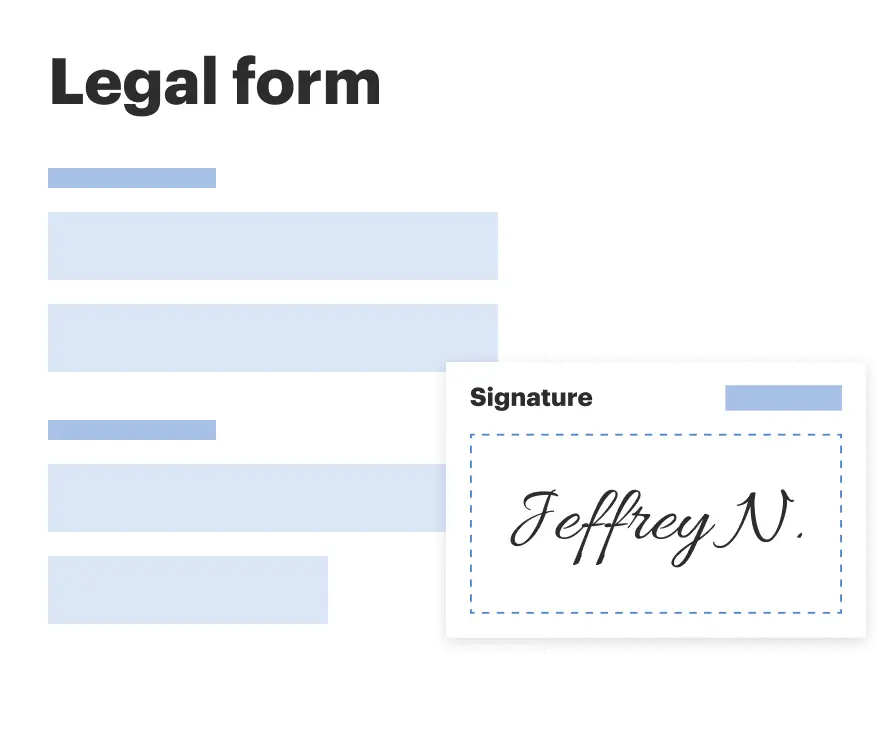
Sign and collect signatures with our SignNow integration. Send to multiple recipients, set reminders, and more. Go Premium to unlock E-Sign.
If this form requires notarization, complete it online through a secure video call—no need to meet a notary in person or wait for an appointment.
We protect your documents and personal data by following strict security and privacy standards.
Make edits, fill in missing information, and update formatting in US Legal Forms—just like you would in MS Word.
Download a copy, print it, send it by email, or mail it via USPS—whatever works best for your next step.
Sign and collect signatures with our SignNow integration. Send to multiple recipients, set reminders, and more. Go Premium to unlock E-Sign.

If this form requires notarization, complete it online through a secure video call—no need to meet a notary in person or wait for an appointment.
We protect your documents and personal data by following strict security and privacy standards.
Looking for another form?
How to fill out Demographic Comparison Worksheet?
Are you currently in a circumstance where you need documents for both professional or personal purposes almost daily.
There is a multitude of legitimate document templates accessible online, but finding reliable ones can be challenging.
US Legal Forms offers thousands of form templates, such as the Arizona Demographic Comparison Worksheet, that are crafted to comply with federal and state regulations.
Once you find the appropriate form, click Buy now.
Select the payment plan you prefer, fill out the necessary information to create your account, and purchase the order using your PayPal or credit card.
- If you are already familiar with the US Legal Forms website and possess an account, simply Log In.
- Then, you can download the Arizona Demographic Comparison Worksheet template.
- If you do not have an account and wish to start using US Legal Forms, follow these steps.
- Identify the form you need and ensure it is for your correct city/area.
- Utilize the Review button to evaluate the form.
- Read the description to confirm you have selected the right form.
- If the form is not what you are looking for, use the Search field to find the form that meets your needs.
Form popularity
FAQ
Ancestry. According to the 20052007 American Community Survey conducted by the U.S. Census Bureau, White Americans made up 76.4% of Arizona's population; of which 59.6% were Non-Hispanic Whites. Black people or African Americans made up 3.4% of Arizona's population; of which 3.3% were non-Hispanic black people.
In Arizona in 2020, 31.9% of the total population was Hispanic, 53.8% were white, 4.6% were black, 3.9% were American Indian/Alaska Native and 3.7% were Asian/Pacific Islander. The demographic distribution of women and children in a state, county or city can have an impact on the rates of birth outcomes in that area.
Demographics. Hispanics made up 32% of Arizona's population. The largest ancestry group in Arizona is Mexican (26%). The southern and central parts of the state are predominantly Mexican American, especially in Santa Cruz County and Yuma County near the Mexican border.
The 5 largest ethnic groups in Phoenix, AZ are White (Non-Hispanic) (41.4%), White (Hispanic) (35.3%), Black or African American (Non-Hispanic) (6.89%), Other (Hispanic) (5.57%), and Asian (Non-Hispanic) (3.91%). 37.9% of the households in Phoenix, AZ speak a non-English language at home as their primary language.
Arizona DemographicsWhite: 77.22%Other race: 6.53%Black or African American: 4.50%Native American: 4.50%Two or more races: 3.73%Asian: 3.31%Native Hawaiian or Pacific Islander: 0.21%
Phoenix Demographics According to the most recent ACS, the racial composition of Phoenixwas: White: 72.87% Other race: 10.01% Black or African American: 7.12%
The 5 largest ethnic groups in Arizona are White (Non-Hispanic) (54%), White (Hispanic) (24.4%), Other (Hispanic) (4.87%), Black or African American (Non-Hispanic) (4.38%), and American Indian & Alaska Native (Non-Hispanic) (3.97%).
In Arizona in 2020, 31.9% of the total population was Hispanic, 53.8% were white, 4.6% were black, 3.9% were American Indian/Alaska Native and 3.7% were Asian/Pacific Islander. The demographic distribution of women and children in a state, county or city can have an impact on the rates of birth outcomes in that area.
The 5 largest ethnic groups in Arizona are White (Non-Hispanic) (54%), White (Hispanic) (24.4%), Other (Hispanic) (4.87%), Black or African American (Non-Hispanic) (4.38%), and American Indian & Alaska Native (Non-Hispanic) (3.97%).