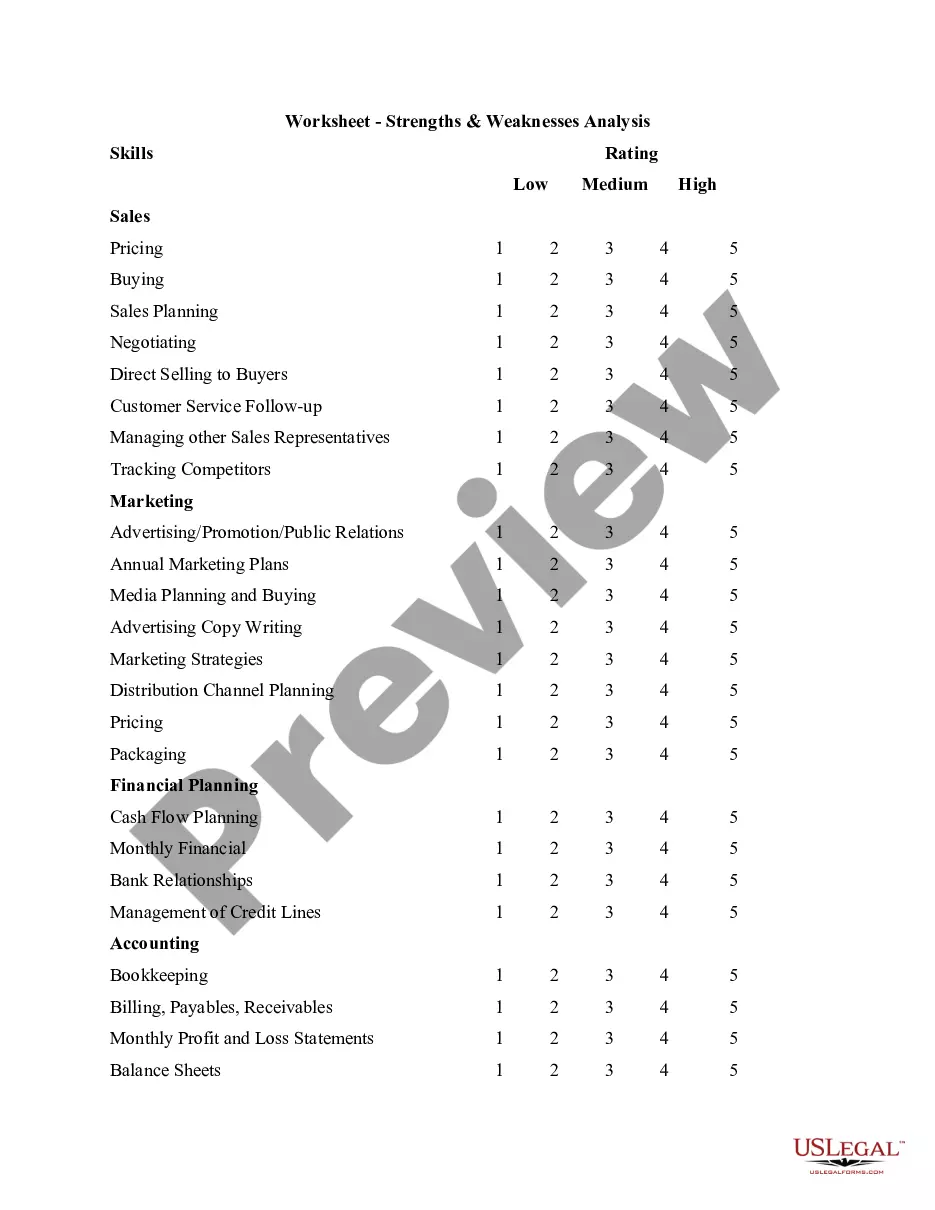
Arizona Demographic Analysis Worksheet
Description


Get your form ready online
Our built-in tools help you complete, sign, share, and store your documents in one place.
Make edits, fill in missing information, and update formatting in US Legal Forms—just like you would in MS Word.
Download a copy, print it, send it by email, or mail it via USPS—whatever works best for your next step.
Sign and collect signatures with our SignNow integration. Send to multiple recipients, set reminders, and more. Go Premium to unlock E-Sign.
If this form requires notarization, complete it online through a secure video call—no need to meet a notary in person or wait for an appointment.
We protect your documents and personal data by following strict security and privacy standards.
Looking for another form?
How to fill out Demographic Analysis Worksheet?
If you wish to total, obtain, or create legal document templates, utilize US Legal Forms, the premier variety of legal forms accessible online.
Take advantage of the site’s straightforward and user-friendly search feature to find the documents you require.
Numerous templates for corporate and personal purposes are organized by categories, regions, or keywords.
Step 3. If you are not satisfied with the form, use the Search field at the top of the screen to find other versions of the legal form template.
Step 4. Once you have located the form you need, click the Buy now button. Choose the pricing plan you prefer and enter your credentials to register for an account.
- Utilize US Legal Forms to acquire the Arizona Demographic Analysis Worksheet in just a few clicks.
- If you are already a US Legal Forms customer, Log In to your account and click the Acquire button to obtain the Arizona Demographic Analysis Worksheet.
- You can also access forms you have previously obtained under the My documents tab in your account.
- If this is your first time using US Legal Forms, follow the instructions outlined below.
- Step 1. Ensure you have selected the form for the correct city/state.
- Step 2. Use the Review option to browse the form’s details. Remember to check the description.
Form popularity
FAQ
Diversity. Goodyear, AZ is home to a population of 80.4k people, from which 94.6% are citizens. As of 2019, 12.1% of Goodyear, AZ residents were born outside of the country (9.73k people). In 2019, there were 2.75 times more White (Non-Hispanic) residents (44.7k people) in Goodyear, AZ than any other race or ethnicity.
Goodyear DemographicsWhite: 75.83% Black or African American: 7.66% Other race: 5.54% Asian: 4.63%
The Goodyear AZ crime rate for 2018 was 247.08 per 100,000 population, a 6.56% decline from 2017. The Goodyear AZ crime rate for 2017 was 264.42 per 100,000 population, a 30.04% decline from 2016.
The value-added forest products and tourism industries are the traditional pillars of the Show Low economy. Other industries include aviation and light manufacturing, medical advancement and services and entrepreneurship.
In the 2020 edition of AZ Big Media's Ranking Arizona poll, Goodyear was ranked as the fourth-best city to live in Arizona, and named Estrella by Newland was named the No. 3 best master-planned community in the state among communities with 2,501 homes or more.
The 5 largest ethnic groups in Arizona are White (Non-Hispanic) (54%), White (Hispanic) (24.4%), Other (Hispanic) (4.87%), Black or African American (Non-Hispanic) (4.38%), and American Indian & Alaska Native (Non-Hispanic) (3.97%).
DemographicsAge.Economic characteristics.Marital status.Race.Sex.
Show Low is The Gateway to Arizona's White Mountains and the quality of life here is unequaled anywhere. The area is famous for its world class hunting and fishing opportunities. Show Low also offers a wealth of dining and shopping opportunities from the national chains to more regional fare.
Show Low DemographicsWhite: 88.63% Other race: 5.97% Native American: 2.23% Two or more races: 1.85%
Demographic information examples include: age, race, ethnicity, gender, marital status, income, education, and employment. You can easily and effectively collect these types of information with survey questions.