Tennessee Demographic Analysis Worksheet
Description


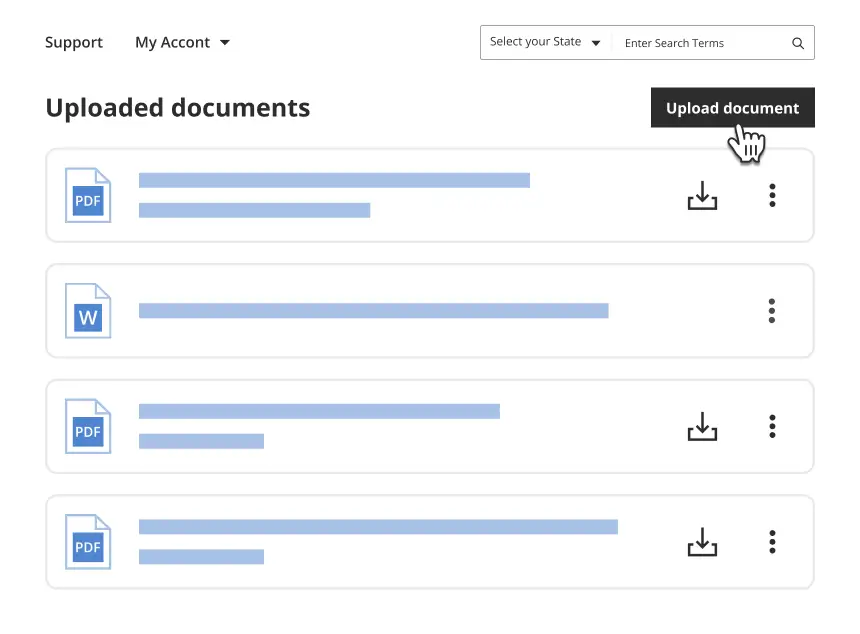
Get your form ready online
Our built-in tools help you complete, sign, share, and store your documents in one place.
Make edits, fill in missing information, and update formatting in US Legal Forms—just like you would in MS Word.
Download a copy, print it, send it by email, or mail it via USPS—whatever works best for your next step.
Sign and collect signatures with our SignNow integration. Send to multiple recipients, set reminders, and more. Go Premium to unlock E-Sign.
If this form requires notarization, complete it online through a secure video call—no need to meet a notary in person or wait for an appointment.
We protect your documents and personal data by following strict security and privacy standards.
Looking for another form?
How to fill out Demographic Analysis Worksheet?
US Legal Forms - one of the most essential collections of legal documents in the USA - provides a selection of legal form templates that you can download or create.
By using the website, you can find thousands of forms for business and personal purposes, categorized by types, states, or keywords. You can access the latest forms like the Tennessee Demographic Analysis Worksheet within moments.
If you already have an account, Log In to obtain the Tennessee Demographic Analysis Worksheet from the US Legal Forms library. The Download button will be visible on each form you view. You have access to all previously downloaded forms in the My documents section of your account.
Process the payment. Use a credit card or PayPal account to finalize the purchase.
Select the format and download the form to your device. Make edits. Fill out, modify, print, and sign the downloaded Tennessee Demographic Analysis Worksheet. Each template saved in your account has no expiration date and is yours permanently. So, if you need to download or print another copy, simply go to the My documents section and click on the form you require. Access the Tennessee Demographic Analysis Worksheet with US Legal Forms, the most extensive collection of legal document templates. Utilize thousands of professional and state-specific templates that fulfill your business or personal needs and requirements.
- Before using US Legal Forms for the first time, here are simple steps to get started.
- Ensure you have chosen the correct form for your city/region. Click the Review button to check the form's details.
- Review the form description to confirm that you have selected the right form.
- If the form does not meet your needs, use the Search box at the top of the screen to find one that does.
- If you are satisfied with the form, confirm your selection by clicking the Buy now button.
- Then, choose your preferred payment plan and provide your information to create an account.
Form popularity
FAQ
According to the data, Tennessee saw an increase of 55,099 new residents from mid-2020 to mid-2021.
Glencliff. #1 Most Diverse Places to Live in Tennessee.
Nashville Census tracts with the largest drop in the average African-American populationGermantown / Salemtown / Hope Gardens / Buena Vista: From 60.4% black to 38.4%Edgehill: From 67.1% black to 49.8%Chestnut Hill: From 91.9% black to 74.8%Greenwood / Eastwood Neighbors (East Nashville): From 40.0% black to 22.8%
White alone remains the largest race or ethnic group in the state, with 4.9 million of Tennessee's 6.91 million residents in 2020 selecting that response. Black or African American alone residents totaled 1.08 million and were the state's second largest group.
Tennessee Demographics White: 77.58% Black or African American: 16.76%
White alone now includes 70.9% of Tennessee's population, down from 75.6% in 2010. Black or African American alone population shares fell from 16.5% to 15.7% over the same period. Hispanic or Latino ethnicity grew by 2.3 percentage points to 6.9% and remained the state's third largest race or ethnic group.
Tennessee DemographicsWhite: 77.58% Black or African American: 16.76% Two or more races: 2.20% Asian: 1.75%
New York city had the largest number of people reporting as Black with about 2.3 million, followed by Chicago, 1.1 million, and Detroit, Philadelphia and Houston, which had between 500,000 and 1 million each.
Tennessee population growth is steady for the last 10 years from 2010 to 2020 with the average growth of 0.8%. According to U.S. 2020 Census Results, TN population in 2020 is 6,910,840. Tennessee population in 2021 is estimated to be 6.97 million.
African Americans in the seven counties of Shelby (483,381), Davidson (173,730), Hamilton (67,900), Knox (38,045), Madison (35,636), Montgomery (32,982), and Rutherford (32,886) make up over 81% of the all African Americans in the state.