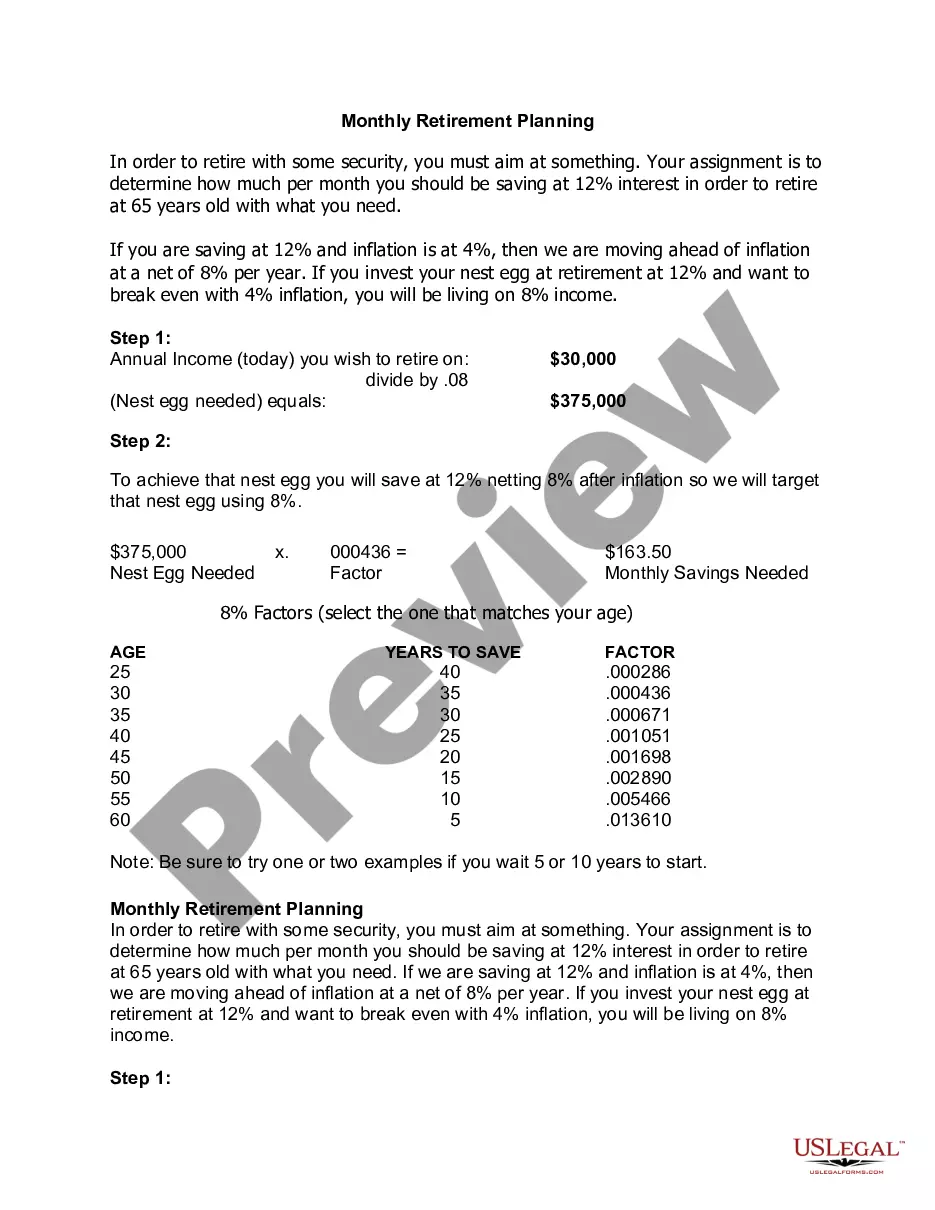
Rhode Island Recommended Spending Percentages
Description
Get your form ready online
Our built-in tools help you complete, sign, share, and store your documents in one place.
Make edits, fill in missing information, and update formatting in US Legal Forms—just like you would in MS Word.
Download a copy, print it, send it by email, or mail it via USPS—whatever works best for your next step.
Sign and collect signatures with our SignNow integration. Send to multiple recipients, set reminders, and more. Go Premium to unlock E-Sign.
If this form requires notarization, complete it online through a secure video call—no need to meet a notary in person or wait for an appointment.
We protect your documents and personal data by following strict security and privacy standards.
Make edits, fill in missing information, and update formatting in US Legal Forms—just like you would in MS Word.

Download a copy, print it, send it by email, or mail it via USPS—whatever works best for your next step.

Sign and collect signatures with our SignNow integration. Send to multiple recipients, set reminders, and more. Go Premium to unlock E-Sign.

If this form requires notarization, complete it online through a secure video call—no need to meet a notary in person or wait for an appointment.
We protect your documents and personal data by following strict security and privacy standards.
Looking for another form?
How to fill out Recommended Spending Percentages?
Finding the correct legal document template can be a significant challenge.
Clearly, there are numerous templates available online, but how do you locate the legal document you require.
Utilize the US Legal Forms website. This service provides a vast array of templates, including the Rhode Island Recommended Spending Percentages, which can serve both business and personal purposes.
You can browse the document using the Review option and read the description to confirm it is suitable for your needs.
- All templates are verified by professionals and comply with federal and state regulations.
- If you are already registered, Log Into your account and click on the Obtain button to access the Rhode Island Recommended Spending Percentages.
- Use your account to search through the legal forms you have previously purchased.
- Navigate to the My documents section of your account to retrieve another copy of the document you need.
- As a new user of US Legal Forms, here are straightforward steps to follow.
- Firstly, ensure you have selected the correct form for your city/county.
Form popularity
FAQ
Among the states, Alaska had the highest per capita state and local spending in 2019 at $17,596, followed by New York ($15,667) and Wyoming ($15,107).
Rhode Island is the 17th-wealthiest state in the United States of America, with a per capita income of $21,688 (2000) and a personal per capita income of $31,916 (2003).
Rhode Island's current budget Rhode Island enacted its FY 2022 budget in July 2021. The enacted budget included $4.6 billion in general fund spending and $13.1 billion in total spending.
Overview of the Rhode Island Economy Rhode Island's gross state product (GSP) in 2019 reached $55.0bn, with growth of 1.1% over the 5-years to 2019. Businesses in Rhode Island employed a total of 24.2 million in 2018, with average annual employment growth of 2.6%.
What is the Use Tax rate? The Rhode Island consumer use tax rate is 7%, which is the same rate as the state sales tax.
Governor Raimondo's FY 2019 $9.37 billion budget embraces the principle that the State must continue to see its long-term investments through, while making difficult, but fiscally responsible decisions to keep Rhode Island's economy moving forward.
Rhode Island's combined state and local general revenues were $12.2 billion in FY 2019, or $11,511 per capita. National per capita general revenues were $10,563. Rhode Island uses all major state and local taxes.
Revenues come mainly from tax collections, licensing fees, federal aid, and returns on investments. Expenditures generally include spending on government salaries, infrastructure, education, public pensions, public assistance, corrections, Medicaid, and transportation.
In Rhode Island in fiscal year 2015, 51 percent of total tax revenues came from sales taxes and gross receipts. Income taxes accounted for 42.3 percent of total state tax collections. Education accounted for 23.6 percent of state expenditures in fiscal year 2015, while 25.1 percent went to Medicaid.