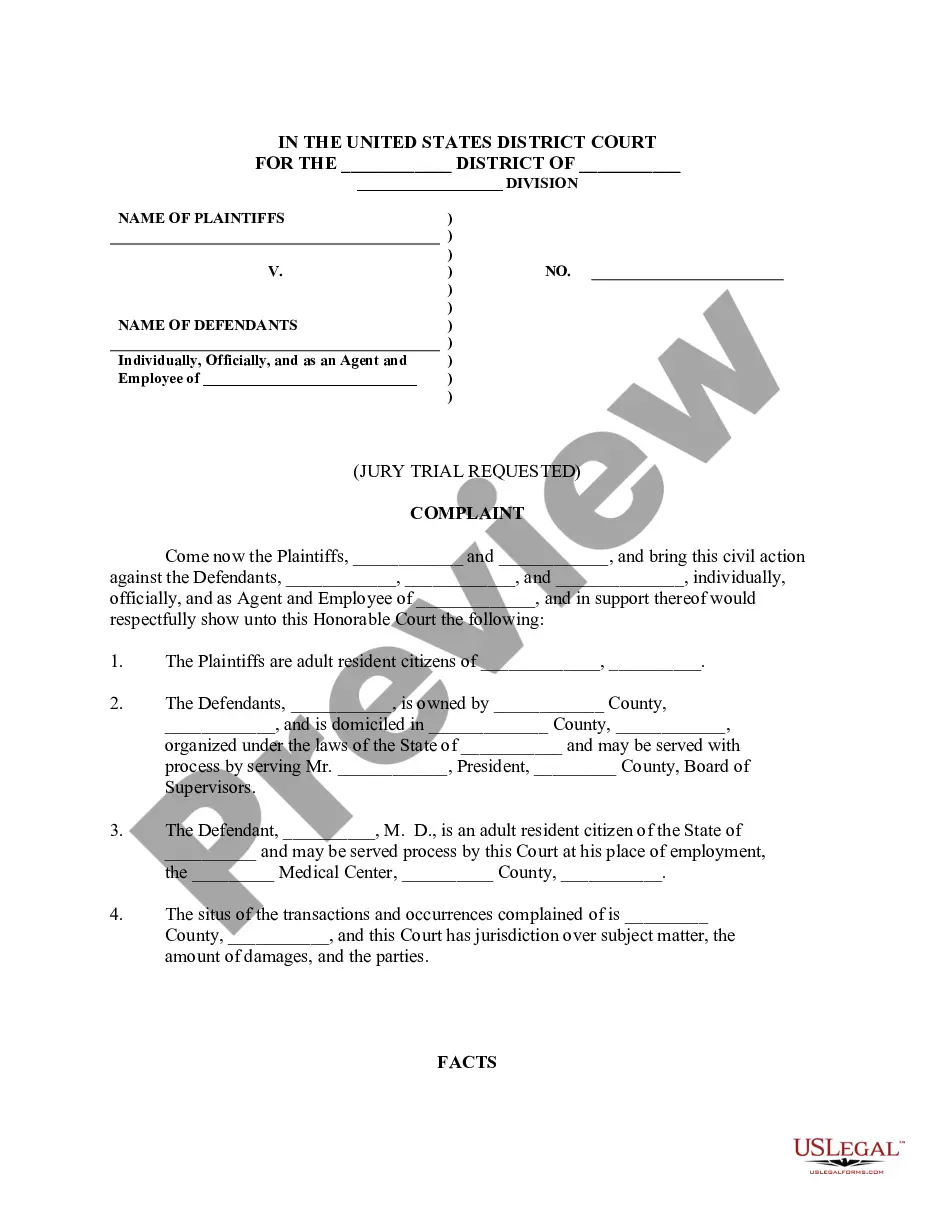
Oregon Demographic Analysis Worksheet
Description


Get your form ready online
Our built-in tools help you complete, sign, share, and store your documents in one place.
Make edits, fill in missing information, and update formatting in US Legal Forms—just like you would in MS Word.
Download a copy, print it, send it by email, or mail it via USPS—whatever works best for your next step.
Sign and collect signatures with our SignNow integration. Send to multiple recipients, set reminders, and more. Go Premium to unlock E-Sign.
If this form requires notarization, complete it online through a secure video call—no need to meet a notary in person or wait for an appointment.
We protect your documents and personal data by following strict security and privacy standards.
Looking for another form?
How to fill out Demographic Analysis Worksheet?
You have the capability to dedicate numerous hours online trying to find the legal document template that satisfies the federal and state requirements you need.
US Legal Forms provides thousands of legal forms that can be reviewed by experts.
It is easy to obtain or print the Oregon Demographic Analysis Worksheet from the platform.
If you wish to find another version of your form, use the Search field to locate the template that suits your needs and preferences.
- If you possess a US Legal Forms account, you can Log In and click the Acquire button.
- You can then fill out, modify, print, or sign the Oregon Demographic Analysis Worksheet.
- Every legal document template you purchase belongs to you indefinitely.
- To get an additional copy of the purchased form, navigate to the My documents section and click the respective button.
- If you're using the US Legal Forms website for the first time, follow the simple instructions below.
- Firstly, make sure you have selected the appropriate document template for your chosen state/city.
- Review the form description to confirm you have chosen the right template.
Form popularity
FAQ
Among people living in Oregon in 2016, 76% identified as white, 13% Latina(o), 5% Asian and Pacific Islander, 2% African American, 1% American Indian and Alaska Native, and 3% two or more races.
Portland DemographicsWhite: 77.38% Asian: 8.18% Black or African American: 5.80% Two or more races: 5.34%
REALD is a type of demographic information, like age, marital status, employment and more. REALD stands for the types of information it includes: Race.
Demographic information examples include: age, race, ethnicity, gender, marital status, income, education, and employment. You can easily and effectively collect these types of information with survey questions.
Access the Data2020 Census Data U.S. Census Bureau.data.census.gov (formerly American Fact Finder) U.S. Census Bureau.Virginia-specific data. Quick Facts Demographic Data U.S. Census Bureau.National Historical Geographic Information System (NHGIS) Minnesota Population Center.Historical Census Data.
We use current and historical vital records, data on international migration, and Medicare records to produce national estimates of the population on April 1 by age, sex, the DA race categories, and Hispanic origin. The DA population estimates are independent of the decennial census.
(Portland's Black population as a percentage of total population remained unchanged from 2010 to 2020 at about 7.9%.)
Demographic equation is the mathematical equation which helps determine the change in population over a period of time. It is the number of births minus deaths plus or minus the net migration. The basic demographic equation looks like: Population(t+1) = Populationt + Natural Increaset + Net migrationt.
Currently, Oregon's Black population is a hair more than 5.8% of the state's 4.2 million residents.
U.S. Government DataU.S. Bureau of the Census. . Bureau of Labor Statistics. Population Statistics.County Business Patterns.Social Security Administration (Office of Policy)Statistical Abstract of the United States.White House Briefing Room.More items...