Indiana Demographic Analysis Worksheet
Description


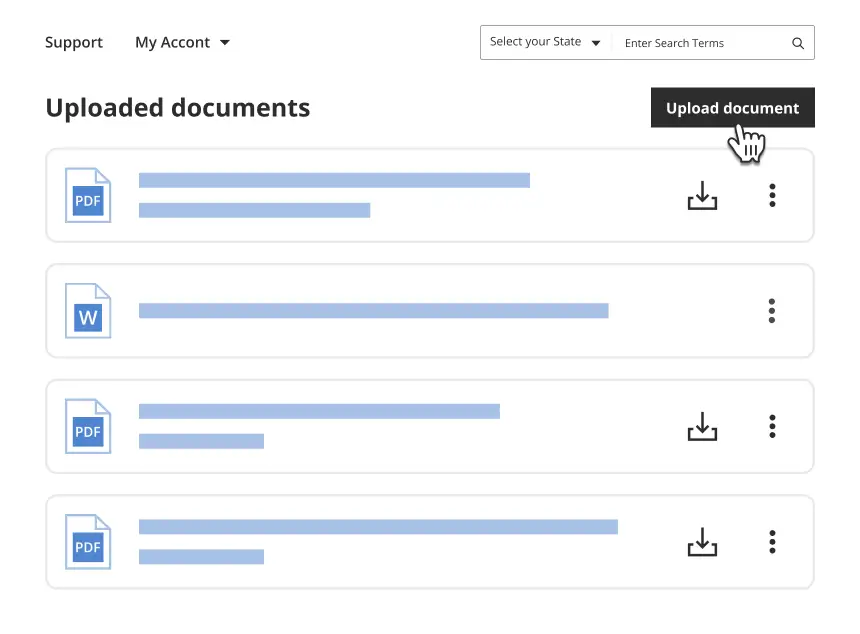
Get your form ready online
Our built-in tools help you complete, sign, share, and store your documents in one place.
Make edits, fill in missing information, and update formatting in US Legal Forms—just like you would in MS Word.
Download a copy, print it, send it by email, or mail it via USPS—whatever works best for your next step.
Sign and collect signatures with our SignNow integration. Send to multiple recipients, set reminders, and more. Go Premium to unlock E-Sign.
If this form requires notarization, complete it online through a secure video call—no need to meet a notary in person or wait for an appointment.
We protect your documents and personal data by following strict security and privacy standards.

Make edits, fill in missing information, and update formatting in US Legal Forms—just like you would in MS Word.
Download a copy, print it, send it by email, or mail it via USPS—whatever works best for your next step.
Sign and collect signatures with our SignNow integration. Send to multiple recipients, set reminders, and more. Go Premium to unlock E-Sign.

If this form requires notarization, complete it online through a secure video call—no need to meet a notary in person or wait for an appointment.
We protect your documents and personal data by following strict security and privacy standards.
Looking for another form?
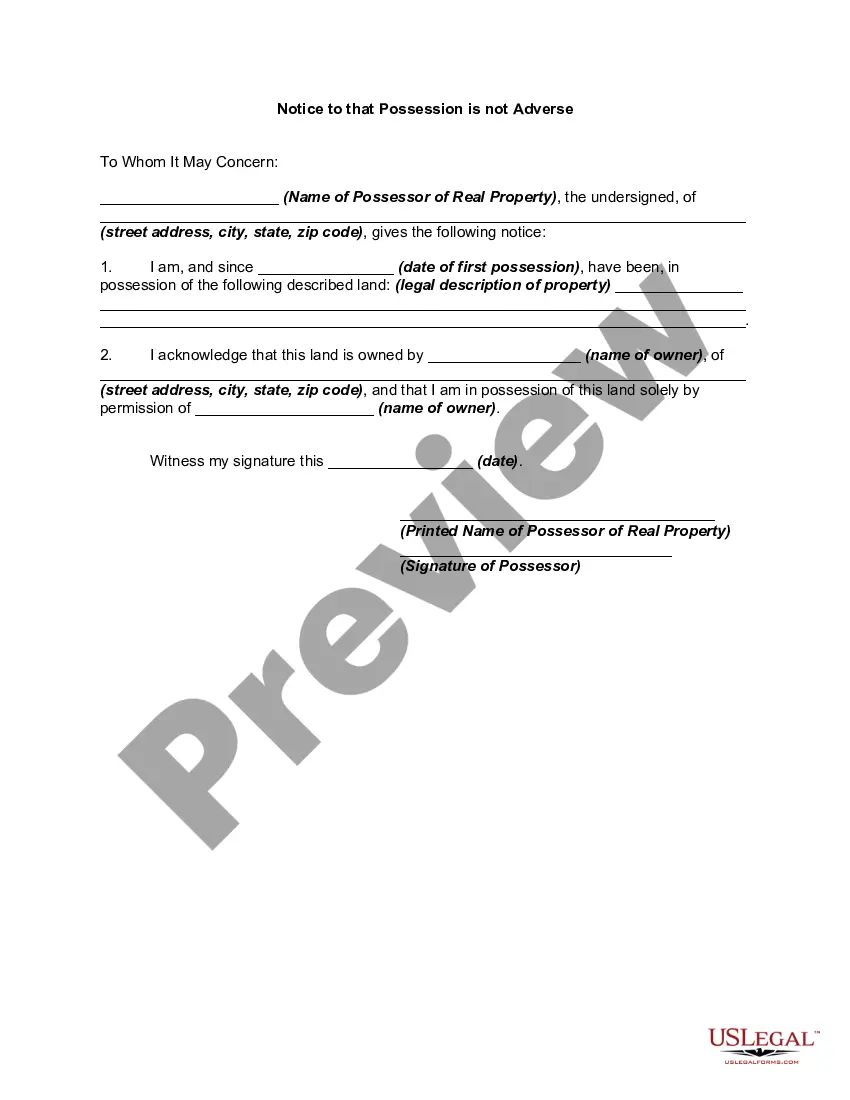

How to fill out Demographic Analysis Worksheet?
You might invest time online trying to discover the sanctioned document template that meets the government and state stipulations you seek.
US Legal Forms provides a vast array of legal forms that have been reviewed by experts.
You can obtain or create the Indiana Demographic Analysis Worksheet from their service.
If available, utilize the Review button to view the document template as well.
- If you already have a US Legal Forms account, you can sign in and click the Acquire button.
- Afterward, you can complete, modify, create, or sign the Indiana Demographic Analysis Worksheet.
- Every legal document template you receive is yours permanently.
- To obtain an additional copy of the downloaded form, navigate to the My documents tab and click the relevant button.
- If you are visiting the US Legal Forms site for the first time, follow the simple instructions below.
- First, ensure you have chosen the correct document template for the area/region you select.
- Review the form description to confirm you have selected the right type.
Form popularity
FAQ
In 2021, about 6.81 million people lived in Indiana. This was an increase from the previous year, when about 6.79 million people lived in the state. In 1960, the resident population of Indiana was about 4.66 million people.
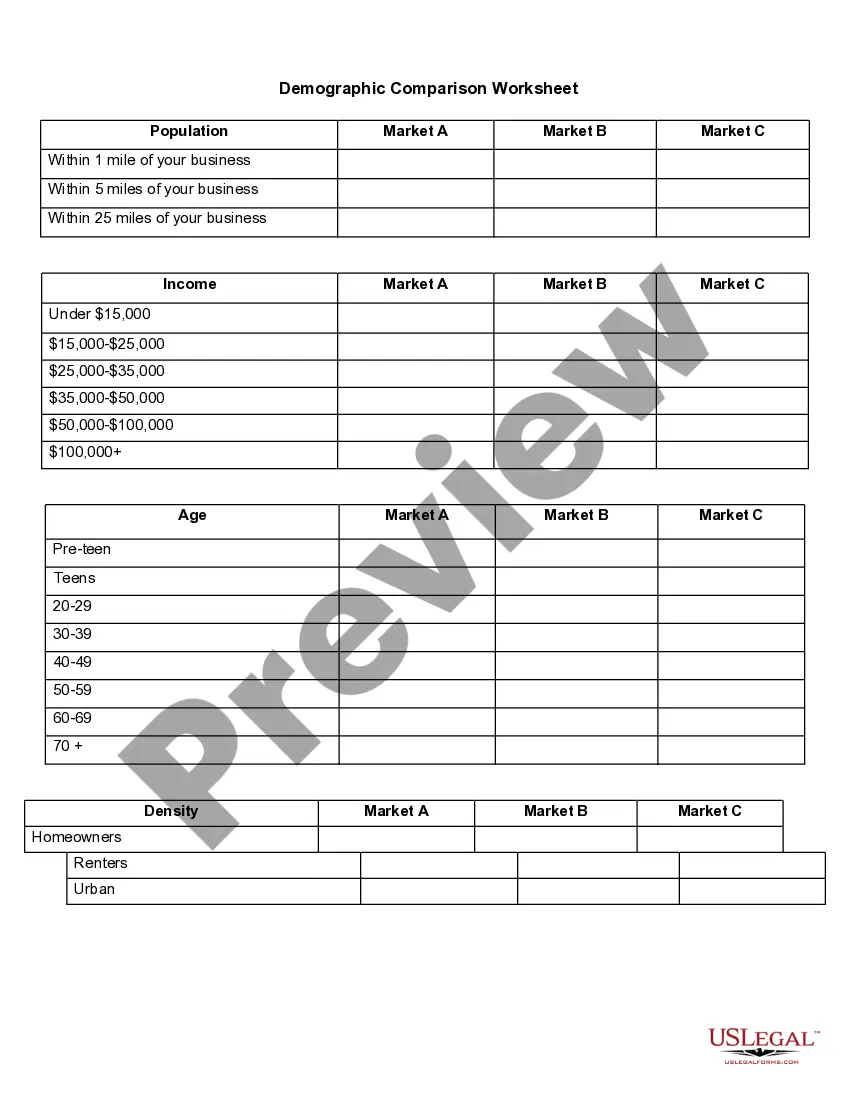
What is demographic data? Demographic data is information on the size, growth or distribution of the population. Perhaps surprisingly, demographic data can tell you more about your community than its size and whether it is growing or declining.
While the percentage of the white population continues to decrease, in 2019 the actual number of white residents in Indianapolis increased significantly. The total count reached 526,643, rising by 4%, after dropping from 554,423 to 507,005 between 1990 and 2010, according to 2019 ACS five-year estimates.
Looking at total population counts by race and ethnic group, the majority of Indiana's 6.8 million residents are white (5.12 million), followed by Black (637,500), Hispanic (554,191), multi-race (265,344), Asian (166,651), American Indian or Alaska Native (12,938), and Native Hawaiian or other Pacific Islander (2,761).
Main examples of local statistics include:Census data (Nomis web): every 10 years British households are surveyed.Census data for neighbourhood statistics.Open data for communities: official UK Department for Communities and Local Government linked data platform.More items...?18-Nov-2019
Access the Data2020 Census Data U.S. Census Bureau.data.census.gov (formerly American Fact Finder) U.S. Census Bureau.Virginia-specific data. Quick Facts Demographic Data U.S. Census Bureau.National Historical Geographic Information System (NHGIS) Minnesota Population Center.Historical Census Data.
In 2021, about 6.81 million people lived in Indiana. This was an increase from the previous year, when about 6.79 million people lived in the state. In 1960, the resident population of Indiana was about 4.66 million people.
Through various programs the United States Census Bureau collects and publishes statistics on U.S. businesses....U.S. Census BureauCensus Business Builder.County Business Patterns.Economic Census.Survey of Business Owners.15-Feb-2022
For a complete definition for each racial and ethnic category see Appendix A. The majority of Indiana's population is white (88.7%), followed by African-Americans (8.8%), Asian-Americans (1.2%) and American Indians and Alaska Natives (0.3%).
Demographics comprise an array of socioeconomic information, including the breakdown of a population by gender, age, ethnicity, income, employment status, home ownership, and even internet access.