Maine Worksheet - Trend Analysis
Description

Get your form ready online
Our built-in tools help you complete, sign, share, and store your documents in one place.
Make edits, fill in missing information, and update formatting in US Legal Forms—just like you would in MS Word.
Download a copy, print it, send it by email, or mail it via USPS—whatever works best for your next step.
Sign and collect signatures with our SignNow integration. Send to multiple recipients, set reminders, and more. Go Premium to unlock E-Sign.
If this form requires notarization, complete it online through a secure video call—no need to meet a notary in person or wait for an appointment.
We protect your documents and personal data by following strict security and privacy standards.
Looking for another form?
How to fill out Worksheet - Trend Analysis?
You are capable of dedicating hours online searching for the official document template that complies with both state and federal requirements you need.
US Legal Forms offers numerous legal forms that have been reviewed by experts.
You can download or print the Maine Worksheet - Trend Analysis from my service.
If available, use the Review button to review the document template as well.
- If you already possess a US Legal Forms account, you can Log In and then click the Download button.
- Then, you can fill out, modify, print, or sign the Maine Worksheet - Trend Analysis.
- Every legal document template you obtain is yours forever.
- To retrieve an additional copy of a purchased form, navigate to the My documents tab and click the corresponding button.
- If this is your first time using the US Legal Forms website, follow the simple instructions below.
- First, ensure that you have selected the correct document template for the area/region of your choice.
- Review the form details to confirm you have chosen the right form.
Form popularity
FAQ
Seniors in Maine can benefit from an increased standard deduction on their state income tax. This additional deduction assists them in reducing their taxable income, which can lead to potential savings. The Maine Worksheet - Trend Analysis provides a clear view of how these deductions affect your financial planning. Make sure to leverage the US Legal Forms resources to navigate these benefits.
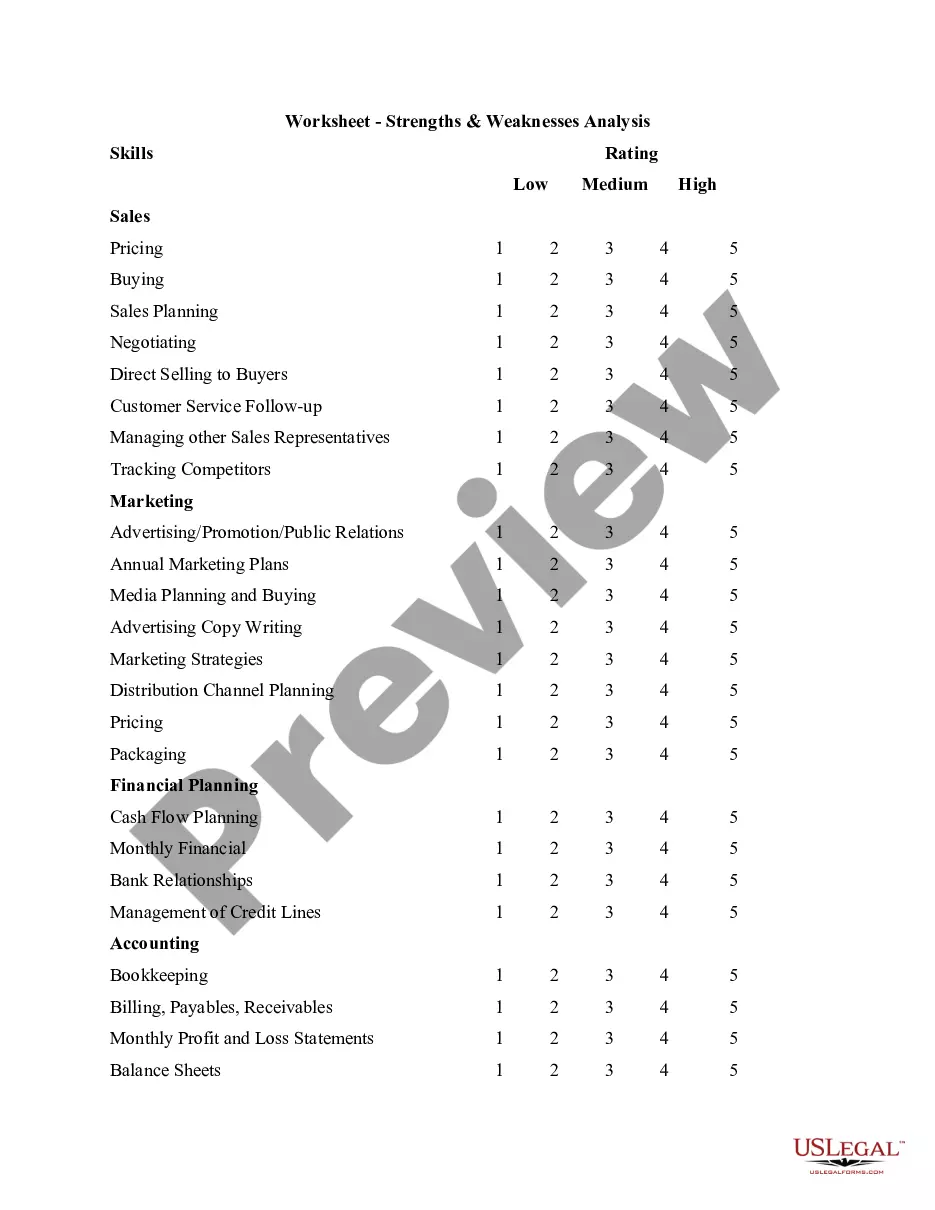
Examples of Trend AnalysisExamining sales patterns to see if sales are declining because of specific customers or products or sales regions; Examining expenses report claims for proof of fraudulent claims. Examining expense line items to find out if there are any unusual expenditures in a reporting period.
The TREND function returns values along a linear trend. It fits a straight line (using the method of least squares) to the array's knowny's and knownx's. TREND returns the y-values along that line for the array of newx's that you specify.
1 Choose Which Pattern You Want to Identify. The first and most obvious step in trend analysis is to identify which data trend you want to target.2 Choose Time Period.3 Choose Types of Data Needed.4 Gather Data.5 Use Charting Tools to Visualize Data.6 Identify Trends.
A trend can often be found by establishing a line chart. A trendline is the line formed between a high and a low. If that line is going up, the trend is up. If the trendline is sloping downward, the trend is down.
The Excel TREND function is used to calculate a linear trend line through a given set of dependent y-values and, optionally, a set of independent x-values and return values along the trend line.
Add a trendlineSelect a chart.Select the + to the top right of the chart.Select Trendline. Note: Excel displays the Trendline option only if you select a chart that has more than one data series without selecting a data series.In the Add Trendline dialog box, select any data series options you want, and click OK.
In order to do trend analysis, you must decide on what segment, industry, or even asset you want to use. For example, you may want to look at the bond market. Once you make this decision, you also need to determine the period. There is no consensus on the actual amount of time for the movement to be considered a trend.
There are three main types of trends: short-, intermediate- and long-term.
Trend analysis involves the collection of information from multiple time periods and plotting the information on a horizontal line for further review. The intent of this analysis is to spot actionable patterns in the presented information.