Kentucky Consumer Price Index

State:
Multi-State
Control #:
US-OL1904
Format:
Word; 
PDF
Instant download

Description

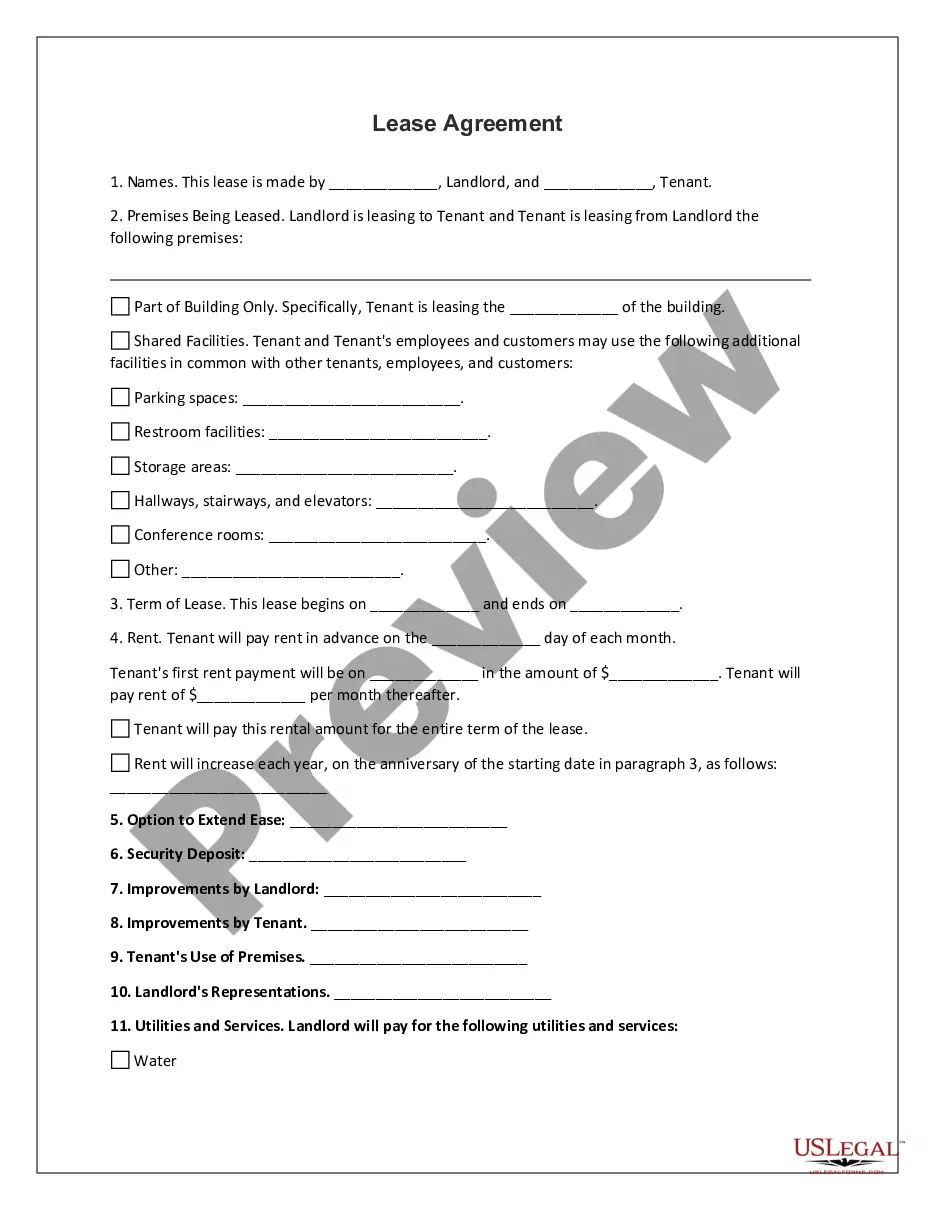
This office lease states the conditions of the annual rental rate currently specified to be paid by the tenant (the "Base Rent"). This shall be used as a basis to calculate additional rent as of the times and in the manner set forth in this form to be paid by the tenant.

The Kentucky Consumer Price Index (CPI) is a measure of the average change over time in the prices paid by urban consumers for a market basket of consumer goods and services in the state of Kentucky. It serves as a crucial economic indicator, providing insights into the current inflation or deflation trends within the state. The Kentucky CPI is calculated and reported regularly by the Kentucky State Data Center and the U.S. Bureau of Labor Statistics (BLS). The Kentucky CPI takes into account various expense categories, including housing, transportation, food and beverages, healthcare, education, apparel, recreation, and more. It collects data from both urban areas and metropolitan regions of the state, covering a wide range of consumer expenditures. The CPI is essential for policymakers, economists, businesses, and individuals alike. It aids in determining adjustments to wages, benefits, retirement income, and social security payments to ensure they keep pace with the rising cost of living. Government agencies utilize the Kentucky CPI to adjust tax brackets, support economic forecasting, and assess the effectiveness of economic policies. Within the overall Kentucky CPI, there are different types or components that track specific aspects of consumer spending. These include: 1. CPI-U: The Urban Consumer Price Index, which measures changes in prices for goods and services purchased by urban consumers across the nation. It covers approximately 93% of the total population, including both wage earners and clerical workers. 2. CPI-W: The Consumer Price Index for Urban Wage Earners and Clerical Workers focuses on urban households with at least 50% of the income deriving from clerical or wage occupations. It primarily tracks the expenses of households that fall within this category. 3. CPI-M: The Consumer Price Index for All Urban Consumers in the Midwest region, which narrows down the CPI data to monitor price changes specifically in the Midwestern states, including Kentucky. It provides a localized perspective on inflation within the region. These different types of CPI help analysts and researchers gain valuable insights into unique demographic spending patterns, regional variations, and sector-specific effects on consumer prices. In conclusion, the Kentucky Consumer Price Index is a comprehensive tool used to measure inflation and understand price changes in consumer goods and services in the state. It aids in making informed decisions regarding income adjustments, economic policies, and financial planning. The CPI-U, CPI-W, and CPI-M are some specific types of CPI that allow for further analysis and understanding of different aspects of consumer spending and price fluctuations.

Free preview
  • Preview Consumer Price Index
  • Preview Consumer Price Index

How to fill out Kentucky Consumer Price Index?

Are you in a situation the place you need documents for sometimes business or person reasons virtually every time? There are tons of authorized papers web templates available on the net, but locating kinds you can depend on is not simple. US Legal Forms gives a large number of type web templates, such as the Kentucky Consumer Price Index, which can be published to satisfy state and federal demands.

In case you are already familiar with US Legal Forms internet site and have an account, basically log in. Afterward, you are able to acquire the Kentucky Consumer Price Index format.

If you do not have an profile and need to begin using US Legal Forms, adopt these measures:

  1. Find the type you need and ensure it is for your correct metropolis/county.
  2. Use the Review key to review the shape.
  3. Browse the information to ensure that you have chosen the right type.
  4. In case the type is not what you`re searching for, make use of the Research industry to find the type that fits your needs and demands.
  5. If you obtain the correct type, click on Get now.
  6. Pick the pricing strategy you would like, fill in the necessary info to produce your account, and buy an order using your PayPal or credit card.
  7. Select a convenient data file structure and acquire your duplicate.

Locate all of the papers web templates you may have purchased in the My Forms food selection. You can obtain a further duplicate of Kentucky Consumer Price Index any time, if required. Just click on the essential type to acquire or printing the papers format.

Use US Legal Forms, by far the most comprehensive selection of authorized kinds, to save time as well as prevent errors. The assistance gives expertly manufactured authorized papers web templates which you can use for a range of reasons. Create an account on US Legal Forms and begin producing your way of life easier.

Form popularity

FAQ

Consumer Price Index | Ministry of Labour & Employment|Government of India.

Here's the inflation breakdown for October 2023 ? in one chart All items3.2% 3.2% 3.2%Food away from home5.4% 5.4% 5.4%Food from vending machines + mobile vendors14.9% 14.9% 14.9%Food at employee sites + schools5.4% 5.4% 5.4%Alcoholic beverages away from home5.3% 5.3% 5.3%25 more rows ? 18 hours ago

The All-India CPI-IW for July, 2023 increased by 3.3 points and stood at 139.7 (one hundred thirty nine point seven). On l-month percentage change, it increased by 2.42 per cent with respect to previous month compared to increase of 0.90 per cent recorded between corresponding months a year ago.

The Consumer Prices Index (CPI) rose by 6.7% in the 12 months to September 2023, the same rate as in August. On a monthly basis, CPI rose by 0.5% in September 2023, the same rate as in September 2022.

Consumer Price Index, Los Angeles area ? September 2023 MonthAll itemsAll items less food and energyDec 20224.94.5Jan 20235.84.5Feb 20235.14.5Mar 20233.74.333 more rows

Consumer Price Index, Los Angeles area ? September 2023 MonthAll itemsAll items less food and energyDec 20224.94.5Jan 20235.84.5Feb 20235.14.5Mar 20233.74.333 more rows

Not seasonally adjusted CPI measures The Consumer Price Index for All Urban Consumers (CPI-U) increased 3.2 percent over the last 12 months to an index level of 307.671 (1982-84=100). For the month, the index was unchanged prior to seasonal adjustment.

Not seasonally adjusted CPI measures The Consumer Price Index for All Urban Consumers (CPI-U) increased 3.7 percent over the last 12 months to an index level of 307.789 (1982-84=100). For the month, the index increased 0.2 percent prior to seasonal adjustment.

Interesting Questions

More info

Oct 12, 2023 — The CPI is based on prices of food, clothing, shelter, fuels, transportation fares, charges for doctors' and dentists' services, drugs, and the ... Jun 8, 2023 — Define the base payment · Identify which CPI series will be used · Specify reference period · State frequency of adjustment · Determine adjustment ...The Consumer Price Index for All Urban Consumers (CPI-U) for the South rose 0.6 percent in August, the U.S. Bureau of Labor Statistics reported today. Select ... The index for all items less food and energy rose 0.2 percent in October, after rising 0.3 percent in September. Indexes which increased in October include rent ... The Kentucky Constitution limits the compensation that elected city officials may ... index (CPI) to determine the maximum COLA rate for city elected officers. This fact sheet provides an overview of the Consumer Price Index (CPI) used in the Tax Increment. Financing (TIF) program. For the statutory program ... 1 Introduction, Overview, and Basic Steps for the Consumer Price Index Development ................................. 1. Introduction . Oct 12, 2023 — Description: We calculate the median CPI and the 16 percent trimmed-mean CPI based on data released in the Bureau of Labor Statistics' monthly ... The Food Price Outlook provides food price data and forecasts changes in the Consumer Price Index (CPI) and Producer Price Index (PPI) for food. The Cleveland Fed also calculates the 16 percent trimmed-mean CPI by taking a weighted average across the component inflation rates after excluding, or trimming ...

Trusted and secure by over 3 million people of the world’s leading companies

Kentucky Consumer Price Index