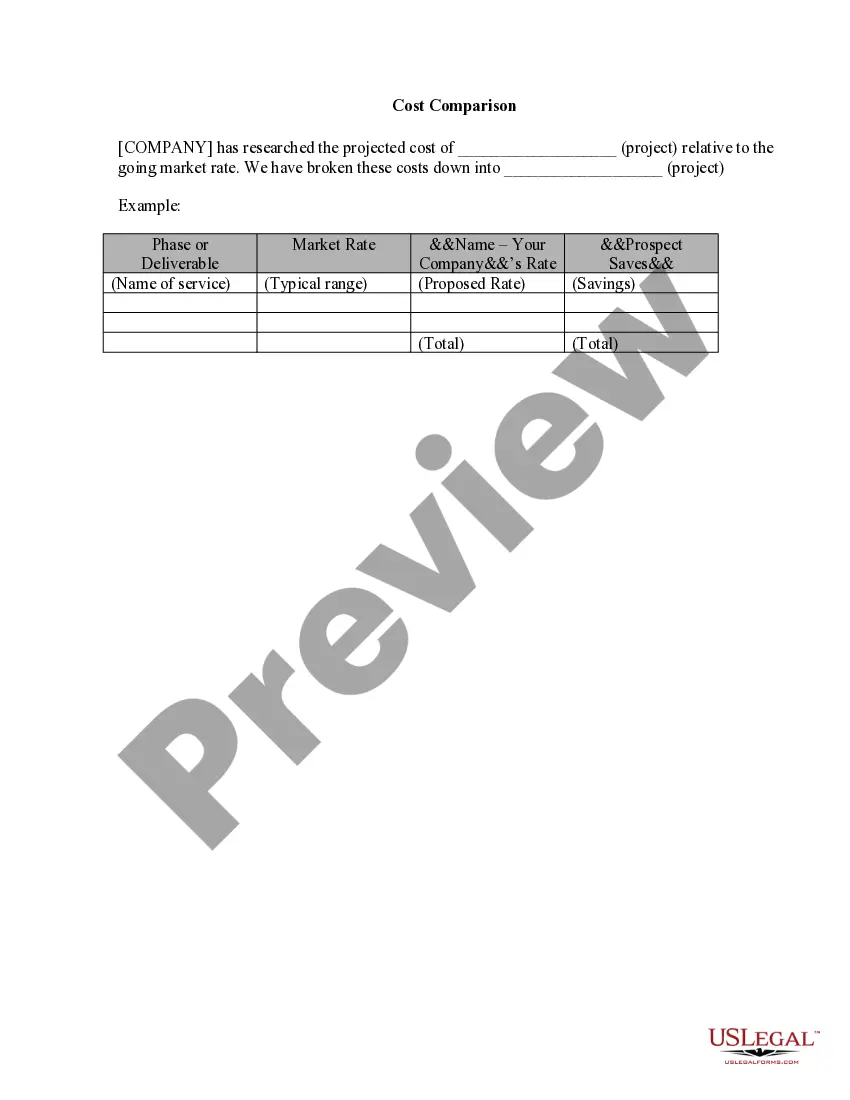
Illinois E-commerce Product-Comparison Matrix
Description


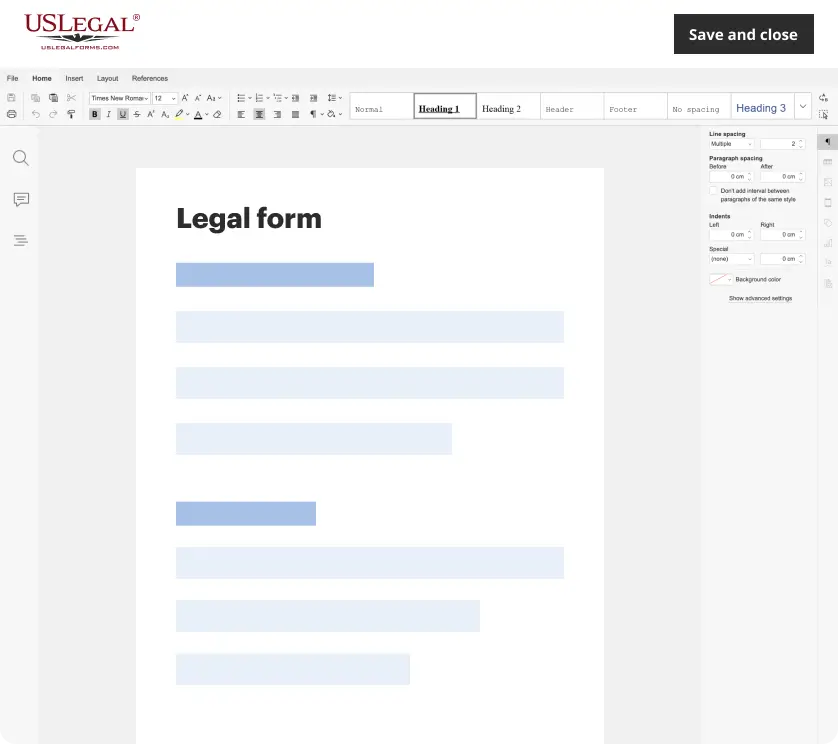
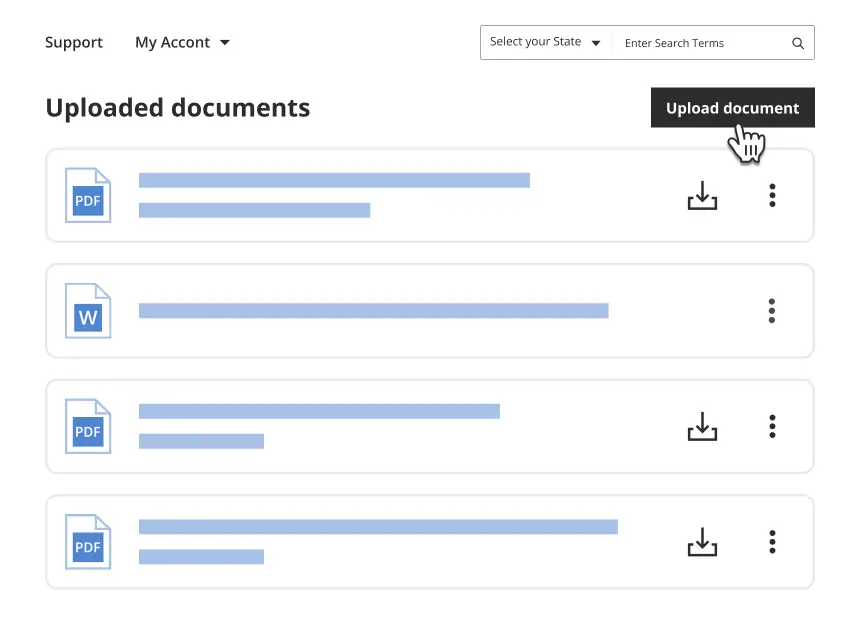
Get your form ready online
Our built-in tools help you complete, sign, share, and store your documents in one place.
Make edits, fill in missing information, and update formatting in US Legal Forms—just like you would in MS Word.
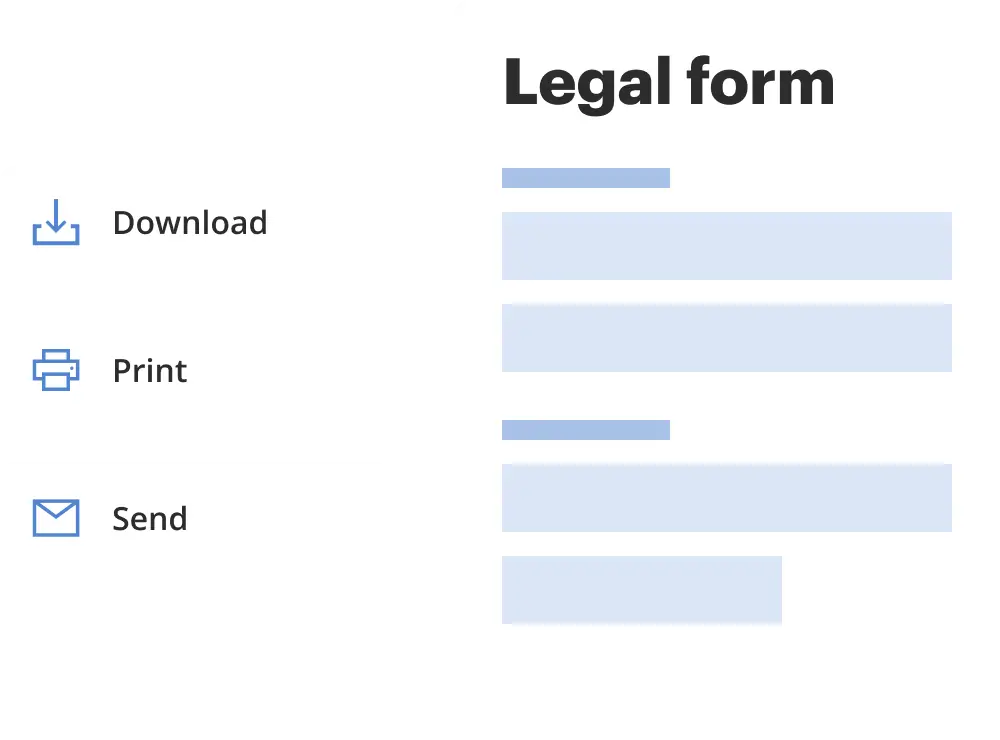
Download a copy, print it, send it by email, or mail it via USPS—whatever works best for your next step.
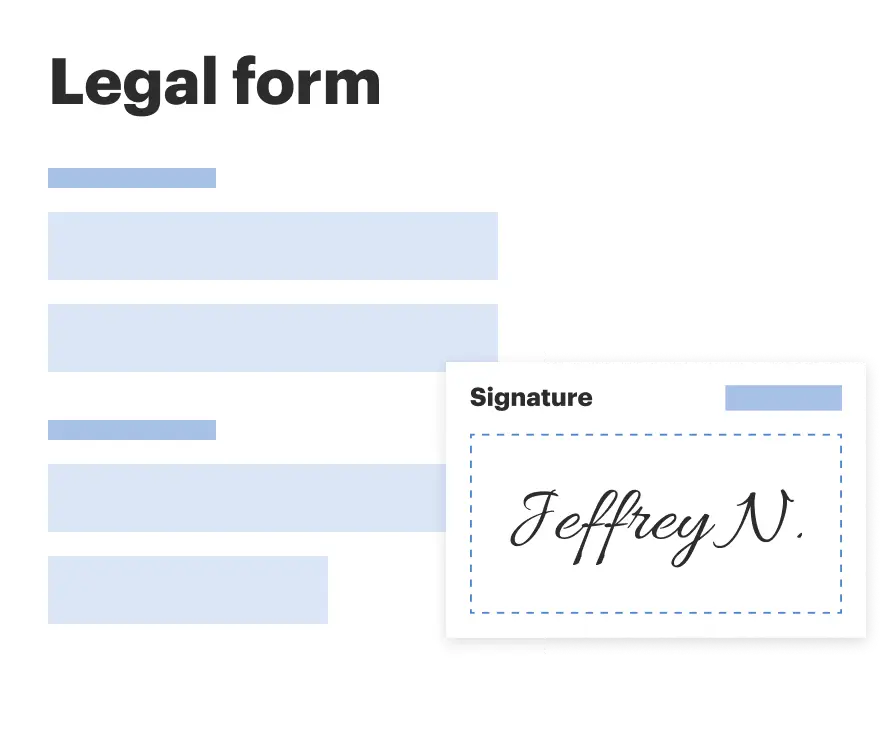
Sign and collect signatures with our SignNow integration. Send to multiple recipients, set reminders, and more. Go Premium to unlock E-Sign.
If this form requires notarization, complete it online through a secure video call—no need to meet a notary in person or wait for an appointment.
We protect your documents and personal data by following strict security and privacy standards.
Make edits, fill in missing information, and update formatting in US Legal Forms—just like you would in MS Word.
Download a copy, print it, send it by email, or mail it via USPS—whatever works best for your next step.
Sign and collect signatures with our SignNow integration. Send to multiple recipients, set reminders, and more. Go Premium to unlock E-Sign.

If this form requires notarization, complete it online through a secure video call—no need to meet a notary in person or wait for an appointment.
We protect your documents and personal data by following strict security and privacy standards.
Looking for another form?
How to fill out E-commerce Product-Comparison Matrix?
US Legal Forms - one of the largest collections of legal documents in the United States - offers a variety of legal templates that you can download or print.
By utilizing the website, you can access thousands of forms for business and personal use, organized by categories, states, or keywords. You can obtain the latest versions of forms, such as the Illinois E-commerce Product-Comparison Matrix, within moments.
If you currently hold a subscription, Log In to download the Illinois E-commerce Product-Comparison Matrix from the US Legal Forms library. The Download button will be visible on every form you view. You can access all previously saved forms from the My documents section of your account.
Choose the file format and download the form to your device.
Make modifications. Complete, edit, print, and sign the saved Illinois E-commerce Product-Comparison Matrix.
- Ensure you have chosen the correct form for your region/county.
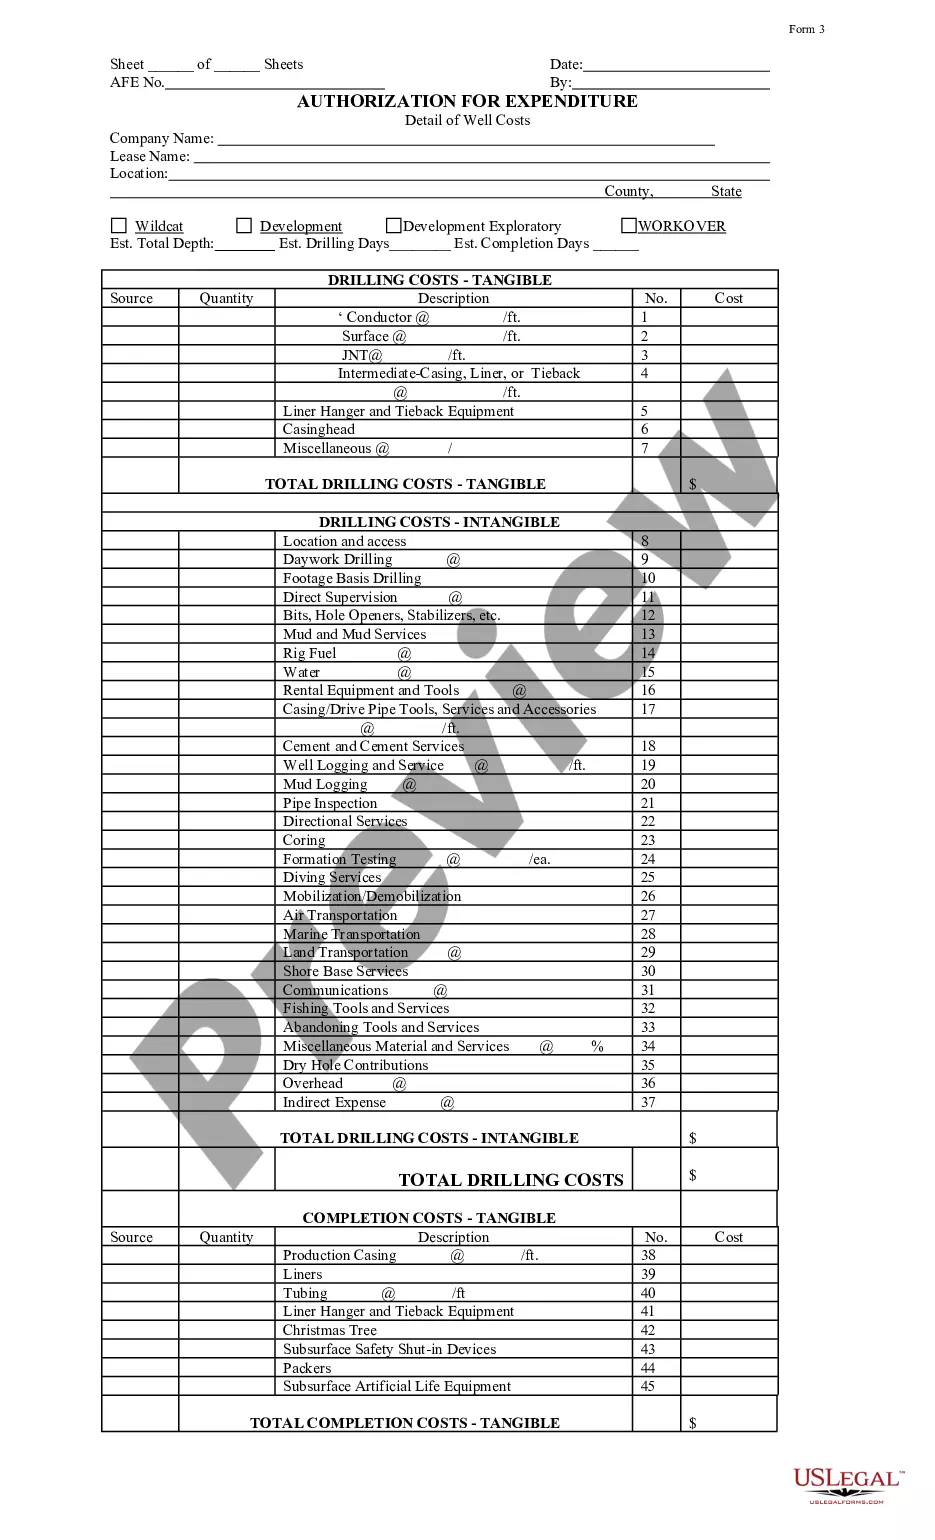
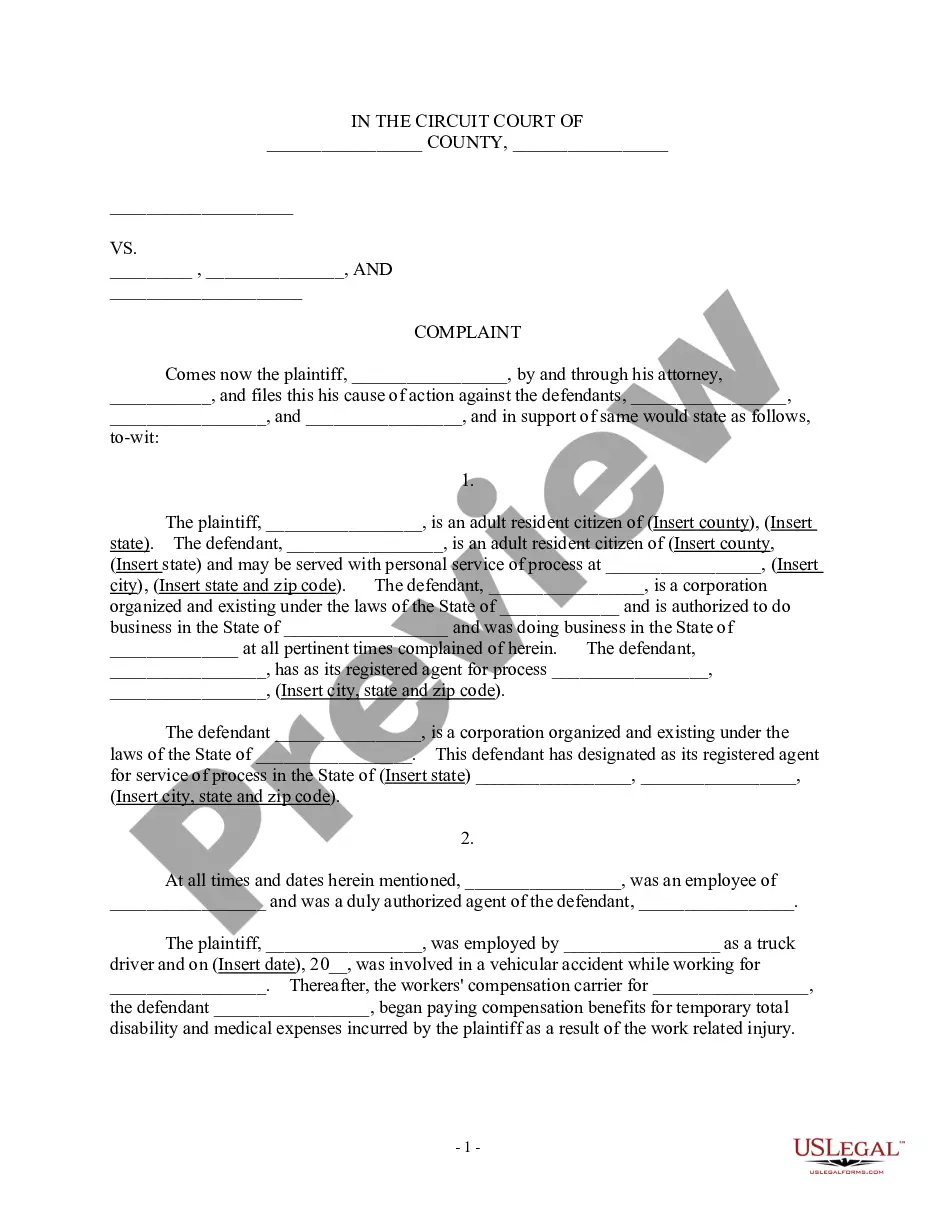
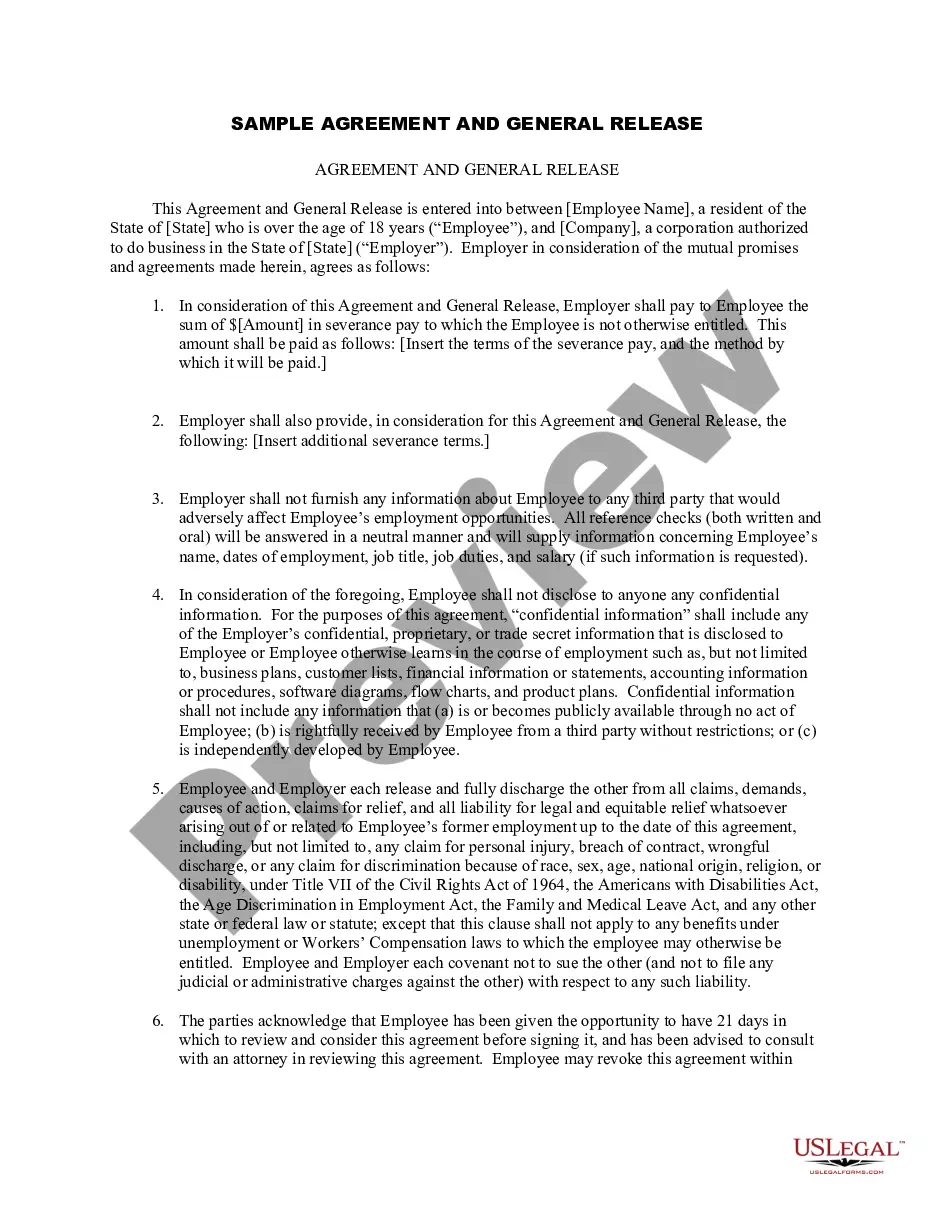
- Click the Preview button to review the details of the form.
- Read the form information to confirm you have selected the appropriate form.
- If the form does not meet your requirements, use the Search area at the top of the page to find one that does.
- Once you are satisfied with the form, confirm your selection by clicking the Get now button.
- Then, select the payment plan you prefer and provide your credentials to sign up for an account.
- Process the transaction. Use your Visa, Mastercard, or PayPal account to complete the transaction.
Form popularity
FAQ
A comparison chart is a chart that draws a comparison between two or more items on different parameters. You can either compare two items such as in the example below. Or, you can use various parameters or comparison points to weigh up two or more items.
How to Create a Comparison Chart in ExcelStep 1 Launch Excel.Step 2 Enter Data.Step 3 Inset Comparison Chart.Step 4 Customize.Step 5 Save.Step 1 Go to Edraw.Step 2 Search Template.Step 3 Add Data and Customize.More items...
How to Create a Product Comparison Template?A general description of the product (what it does, how it looks)The product's purpose (how is it intended to be used, and what pain points it resolves)Practicability and how functional it is.
Use a bar or column chart to compare independent values. We, as readers, are particularly good at comparing the length of bars in a bar chart (in contrast to the segments of a pie chart, for example), making bar and column charts the best charts for showing comparisons.
Here's how to write a definitive product comparison postStep 1: Pick two products or services your readers are interested in. Think through these questions to find the best products to compare:Step 2: Pick some facts about the products to highlight.Step 3: Do your research.Step 4: Write the post.
Competitive Product AnalysisStep 1: Assess your current product pricing. The first step in any product analysis is to assess current pricing.Step 2: Compare key features. Next is a comparison of key features.Step 3: Pinpoint differentiators.Step 4: Identify market gaps.
Bar graphs are used to compare things between different groups or to track changes over time. However, when trying to measure change over time, bar graphs are best when the changes are larger.
How To2026 Undertake a Product ComparisonStep 1: Create a list of competiting products. Determine which products compete directly in the same marketplace as your product.Step 2: Undertake research.Step 3: Create a Product Comparison table.Step 4: Conclusion.
A Venn diagram is one of the most well-known diagrams used to compare and contrast data. It's made up of multiple overlapping circles, each representing a set of data. The common elements between each set of data are represented by the areas of overlap within the circles.
TipsBefore writing about the detailed figures, give an overview of what the graphs or charts represent.Say precisely what the data refers to.You don't need to describe all the information in the diagrams.Don't repeat vocabulary.Use similarly, in the same way or also to show similarities.More items...