How it works
  • Open form

    Open form follow the instructions

  • Easily sign form

    Easily sign the form with your finger

  • Share form

    Send filled & signed form or save

How to use or fill out the 1 3 Stock Market Data Charts online

Filling out the 1 3 Stock Market Data Charts form is an essential step in analyzing stock performance and trading data. This guide provides clear, step-by-step instructions to help you complete the form accurately and efficiently.

Follow the steps to fill out the form with confidence.

  1. Click the ‘Get Form’ button to obtain the form and open it in your preferred online editor.
  2. Enter your name in the designated field at the top of the form. This helps to personalize your document.
  3. Fill in the date in the space provided. Make sure to use the current date or the date relevant to your stock data.
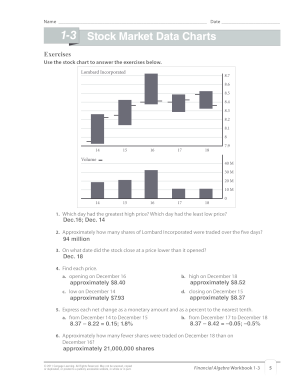
  4. Review the stock chart section. This includes price points and trading volumes for Lombard Incorporated and Nickolai Corp. Take note of the values for accurate data entry.
  5. Address each of the related exercises provided below the stock charts. These exercises require you to analyze data such as high prices, low prices, and trading volumes.
  6. For each question, type your answers directly into the appropriate fields. Be sure to express monetary amounts and percentages as instructed.
  7. After completing all sections and exercises, review your entries for any inaccuracies or missing information.
  8. Once you are satisfied with your entries, you can save your changes, download the document for your records, or print it directly from your online editor.
  9. If needed, you may also share the form with colleagues or advisors for feedback.

Start filling out the 1 3 Stock Market Data Charts online today for a better understanding of stock performance!

Get form

Experience a faster way to fill out and sign forms on the web. Access the most extensive library of templates available.

Related content

Distribution of Household Wealth in the U.S. since...

Sep 19, 2025 — Distribution of Household Wealth in the US since 1989. Select wealth...

Learn more
1 3 Stock Market Data Charts Answer Key

1 3 stock market data charts answer key. **Unlocking Insights with the 1 3 Stock Market...

Learn more
ACTIVE TRADER PRO

The News Tool features: • Streaming Headlines (Tier 3). • Pre-built and Custom search...

Learn more
Questions & Answers

Get answers to your most pressing questions about US Legal Forms API.

Contact support

Why doesn't my Excel have the stock data type?

If your version of Excel does not show the stock data type, you may need to update to a more recent version or enable the feature in your settings. Ensure your subscription includes the latest features. With the proper setup, you can effortlessly create 1 3 Stock Market Data Charts.

To retrieve stock market data in Excel, leverage online finance platforms that offer downloadable data, such as Morningstar or MarketWatch. Import your data files directly into Excel for seamless integration. This will allow you to create insightful 1 3 Stock Market Data Charts.

Similar to the 7% rule in the stock market, this rule advises sellers to cut losses early to avoid significant downtrends. Sticking to this guideline can help keep your portfolio healthy. Tracking your trades and losses on 1 3 Stock Market Data Charts can reinforce this strategy.

To create a stock market chart in Excel, start by gathering your stock data, such as prices and dates. Use the Chart feature in Excel to select your data range and choose your preferred chart type, like line or bar. This process will help you visualize trends in your 1 3 Stock Market Data Charts.

The 80 20 rule, also known as the Pareto Principle, states that 80% of results come from 20% of efforts. In trading, this could mean a small portion of stocks generates the majority of profits. Understanding this concept can help you focus your analysis on key assets in your 1 3 Stock Market Data Charts.

To automatically update stock data in Excel, use the built-in stock data type feature or connect to a web API for real-time data. You can use functions like WEBSERVICE to fetch data from URLs. This integration allows your 1 3 Stock Market Data Charts to reflect the most current information effortlessly.

The 3 5 7 rule is a guideline for trading strategies, emphasizing risk management and trade frequency. It suggests that traders should limit their risk to 3% of their capital, aim for a 5% profit on each trade, and diversify across at least 7 trades. This approach can help you optimize your 1 3 Stock Market Data Charts.

To obtain S&P 500 data in Excel, you can use data sources like Yahoo Finance or Google Finance. These platforms allow you to download stock data as CSV files. Simply import the CSV file into Excel and you can create effective 1 3 Stock Market Data Charts.

For viewing stock charts, many investors recommend using MarketWatch because it combines ease of use with access to 1 3 Stock Market Data Charts. The site offers a range of interactive charts that are user-friendly and informative. You can analyze historical data and explore current market conditions to gain valuable insights. Making informed choices becomes much more manageable with this data at your fingertips.

When it comes to analyzing stocks, a top choice is TradingView, which excels in offering 1 3 Stock Market Data Charts. It provides intuitive charting tools that allow users to visualize trends and patterns effectively. While using TradingView, you can customize your charts to fit your trading strategy, making it easier to spot buy and sell signals. The community features also help you connect with other traders for insights.

Get This Form Now!

Use professional pre-built templates to fill in and sign documents online faster. Get access to thousands of forms.

If you believe that this page should be taken down, please follow our DMCA take down process here.

Get 1 3 Stock Market Data Charts