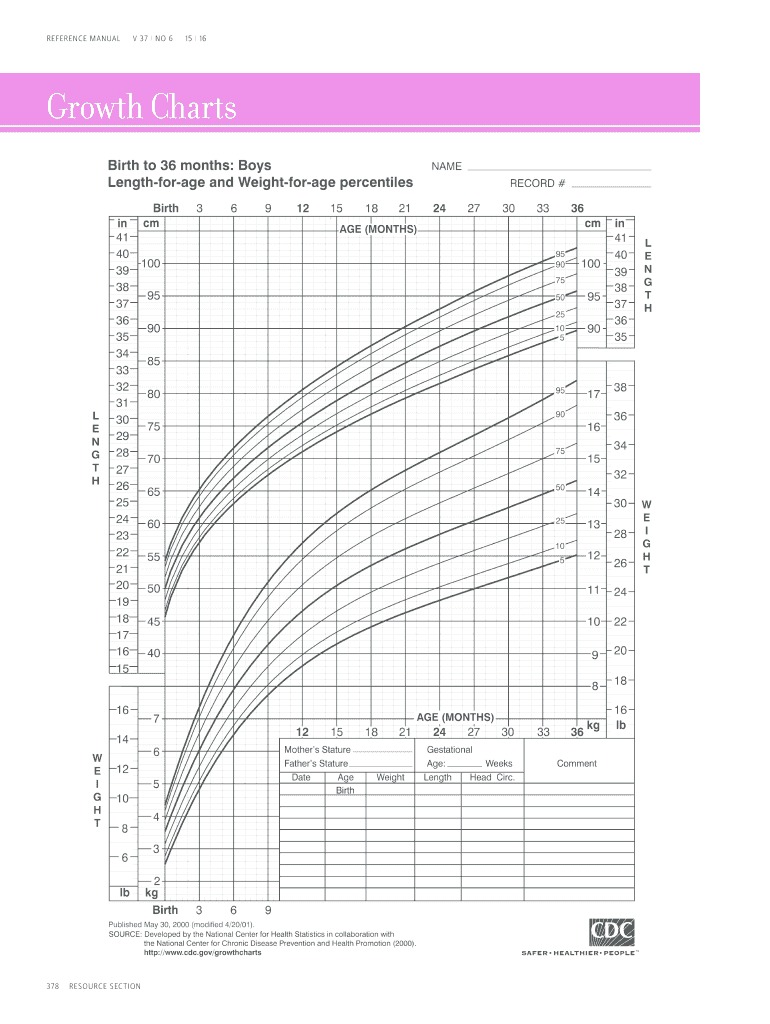
4 / 15 AMERICAN ACADEMY OF PEDIATRIC DENTISTRY RESOURCE SEC TION 375 .

Open form follow the instructions

Easily sign the form with your finger

Send filled & signed form or save
How to fill out the CDC Growth Charts online
The CDC Growth Charts are essential tools for assessing the growth and development of children. This guide will assist you in correctly navigating and completing the charts to ensure accurate tracking of a child's growth metrics.
Follow the steps to successfully fill out the CDC Growth Charts online.
- Press the ‘Get Form’ button to access the growth charts form and open it in your editing tool.
- Begin by entering the child's personal information in the designated fields, including name, date of birth, and sex. This data is crucial for accurate growth assessment.
- Next, input the child's measurements. This includes height, weight, and head circumference. Be sure to use consistent units of measurement (inches or centimeters for height, pounds or kilograms for weight).
- Review the specific growth parameters and select the appropriate chart. Ensure you choose the correct chart based on the child's age range and gender.
- Once all information is entered, review the form for accuracy. Make any necessary corrections to ensure all data reflects current measurements.
- Finally, save your changes, and choose the option to download, print, or share the completed form as needed.
Start filling out your growth charts online today to effectively track your child's progress.
Experience a faster way to fill out and sign forms on the web. Access the most extensive library of templates available.
Related content
The growth charts consist of a series of percentile curves that illustrate the...
Developed by the National Center for Health Statistics in collaboration with the National...
by CDC Recommendation · 1997 · Cited by 5 — The CDC recommends using the references...
Get answers to your most pressing questions about US Legal Forms API.
Why did the CDC adopt the WHO growth chart?
The CDC adopted the WHO growth chart to enhance the understanding of children's growth during the critical early years of life. This change promotes the importance of breastfeeding as a significant factor in healthy growth. By incorporating WHO's evidence-based data, the CDC aims to provide pediatricians and parents with a more comprehensive tool for monitoring growth using CDC Growth Charts.
How do you plot a growth chart?
To plot a growth chart, you begin by measuring your child's height and weight accurately. Next, find the corresponding age on the chart and mark the points on the appropriate axes for height and weight. By connecting these points, you can visualize your child's growth pattern over time, helping you see whether they are tracking within a healthy range on the CDC Growth Charts.
When should I use CDC and WHO growth charts?
The choice between CDC and WHO growth charts generally depends on the child's age. If your child is older than 2 years, the CDC Growth Charts are typically recommended. For infants and toddlers under 2 years old, using WHO growth charts is preferable. Knowing when to use each chart can significantly aid in understanding your child's growth trends.
Which growth chart do pediatricians use?
Pediatricians primarily use CDC Growth Charts for children aged 2 years and older, as they are tailored to the U.S. population. For younger children, or children who are breastfeeding, pediatricians may refer to WHO growth charts. By utilizing these charts, healthcare providers can accurately monitor growth, identify potential health issues, and guide you in ensuring your child's healthy development.
What is a CDC growth chart?
A CDC growth chart is a tool designed to track children's growth over time in the United States. It includes percentiles for height, weight, and body mass index (BMI), which help you compare your child's growth with a representative sample of U.S. children. Pediatricians typically use these charts during health check-ups to assess healthy growth and development, providing vital insights into your child's well-being.
How do the WHO growth charts differ from the CDC growth charts and why are these differences important?
The WHO growth charts are based on the growth patterns of breastfed infants from around the world, while CDC Growth Charts reflect data from children in the United States. These differences are important because they can influence the assessment of your child's growth and health. Using the appropriate chart based on your child's age and dietary habits allows for a more accurate evaluation of growth patterns.
Should I use CDC or WHO growth charts?
When deciding between CDC and WHO growth charts, it often depends on your child's age and health goals. CDC Growth Charts are primarily used for children ages 2 and older, as they are designed for children in the United States. On the other hand, WHO growth charts are better suited for children under 2 years old and are based on a global population. Understanding the purpose of each chart can help you make an informed choice.
How do I read a CDC growth chart?
Reading a CDC Growth Chart involves locating the child's age on the horizontal axis and finding their weight or height on the vertical axis. You can then determine the corresponding percentile, which helps compare the child's measurements to a population of peers. Regularly updating and reviewing these charts with healthcare providers can give a clear picture of a child's growth trajectory.
Who are standard growth charts provided by?
Standard growth charts, including CDC Growth Charts, are provided by authoritative health organizations such as the Centers for Disease Control and Prevention. These charts are developed based on data collected from numerous children across the country, establishing a reliable framework for measuring growth. Utilizing these charts aids parents and healthcare providers in ensuring the healthy development of children.
When to use CDC and WHO growth charts?
You should use CDC Growth Charts for children aged 2 years and older residing in the United States. On the other hand, WHO growth charts are suitable for infants and children aged 0-2 years, capturing their growth patterns effectively. Understanding the age and population helps ensure accurate assessments of a child's growth.
Use professional pre-built templates to fill in and sign documents online faster. Get access to thousands of forms.
If you believe that this page should be taken down, please follow our DMCA take down process here.