Loading

Get Activity: Describing A List Of Numbers With The Ti-82/83
How it works
-
Open form follow the instructions
-
Easily sign the form with your finger
-
Send filled & signed form or save
How to use or fill out the Activity: Describing A List Of Numbers With The TI-82/83 online
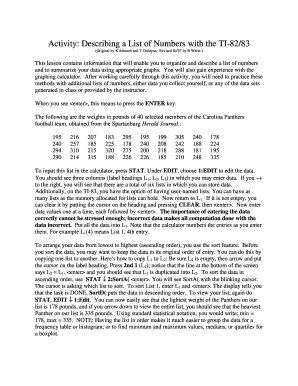
This guide will provide you with a comprehensive overview of how to effectively fill out the Activity: Describing A List Of Numbers With The TI-82/83 online. By following the step-by-step instructions, you will learn how to organize and summarize a list of numbers using the TI-82/83 graphing calculator.
Follow the steps to complete the activity successfully.
- Click the ‘Get Form’ button to download the form and open it in your preferred online document editor.
- Begin by inputting the list of numbers provided in the activity. To do this, press the STAT button on your calculator. Under the EDIT menu, select 1:EDIT to initiate data entry.
- In the data entry screen, you will see columns labeled L1, L2, and L3. To clear L1 if it contains previous data, place the cursor on the heading, press CLEAR, and then hit <enter>. Enter the data values one at a time, ensuring that each value is followed by <enter>.
- To sort the data in ascending order, use the sort feature. First, copy L1 into L2 to maintain the original order. Ensure L2 is empty, then position the cursor on its label, press 2nd 1 (L1), then <enter>.
- To sort the data, choose STAT then scroll down to 2:SortA( and hit <enter>. Enter L1 when prompted and press <enter>. The calculator will notify you when the sort is complete.
- Review the sorted data by navigating back to STAT, selecting EDIT, and choosing 1:Edit. Check to confirm that the lightest and heaviest weights are correctly displayed.
- Create a frequency table by determining appropriate class intervals based on the data range. Calculate the range by subtracting the minimum value from the maximum value and divide this by the number of classes.
- After compiling the frequency table, use graphing options to create a histogram from your frequency data. Ensure both axes are properly labeled and the vertical axis starts at zero.
- Turn off any previous plots by going to STAT PLOT, selecting the appropriate option, and ensuring that Plot 1 is turned off. Set up a new plot for your histogram and follow similar steps to configure the boxplot.
- Finally, gather and summarize your statistical data, including the five-number summary and calculate the mean and standard deviation using the STAT menu under CALC. Record these values accurately.
- Once you have completed the entire form, remember to save your changes, download a copy, or print the completed document.
Start filling out your document online today for a streamlined experience!
0:00 2:39 Right now we're in list 1. You can type values. And press enter and they'll be entered into the listMoreRight now we're in list 1. You can type values. And press enter and they'll be entered into the list. Suppose we didn't want the value 98 there we could scroll to the 98.
Industry-leading security and compliance
US Legal Forms protects your data by complying with industry-specific security standards.
-
In businnes since 199725+ years providing professional legal documents.
-
Accredited businessGuarantees that a business meets BBB accreditation standards in the US and Canada.
-
Secured by BraintreeValidated Level 1 PCI DSS compliant payment gateway that accepts most major credit and debit card brands from across the globe.


