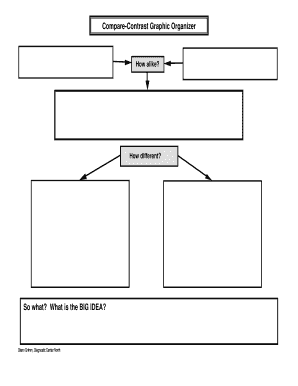
CompareContrast Graphic Organizer kk How alike? How different? So what? What is the BIG IDEA? Diann Grimm, Diagnostic Center North kk.
Open form follow the instructions
Easily sign the form with your finger
Send filled & signed form or save
How to use or fill out the Compare-Contrast Graphic Organizer - California online
The Compare-Contrast Graphic Organizer - California is a useful tool for visually organizing information about similarities and differences between two subjects. This guide will assist you in effectively filling out the form online, ensuring that you capture all important details clearly and systematically.
Follow the steps to fill out the Compare-Contrast Graphic Organizer - California online
- Click ‘Get Form’ button to obtain the Compare-Contrast Graphic Organizer and open it in your browser.
- Begin by identifying the two subjects you will compare and contrast. Write the names of these subjects at the top of the organizer.
- In the 'How alike?' section, list the similarities between the two subjects. Consider their characteristics, qualities, or functions that are shared.
- In the 'How different?' section, detail the differences. Highlight unique characteristics and features that set the subjects apart from each other.
- In the 'So what? What is the BIG IDEA?' section, summarize the significance of the similarities and differences. Discuss what insights or conclusions can be drawn from this comparison.
- Once you have filled out all sections of the form, review your entries for clarity and completeness.
- When satisfied with your organization of information, save your changes. You can then download, print, or share your completed graphic organizer as needed.
Start filling out the Compare-Contrast Graphic Organizer online today!
Experience a faster way to fill out and sign forms on the web. Access the most extensive library of templates available.
Related content
Standard: Compare how people lived and worked before and after the adoption of new...
A Venn Diagram with two overlapping circles to compare two elements. Similarities go in...
4) Graphic Organizers: Use these for comparing and contrasting vocabulary concepts such as...
Get answers to your most pressing questions about US Legal Forms API.
What are the 4 types of graphic organizer?
ing to your data, you can use these types of graphic organizers in your class, such as: Circle Map. A circle map graphic organizer is used to explain related concepts or brainstorm ideas. ... Spider Map. ... Idea Wheel. ... Venn Diagram. ... Tree Chart. ... Sequence of Events Chain.
What are the 5 types of graphic organizer?
Choose the type of organizer that you want from the navigation above or scroll down to see each of the different types included, one by one. 1 Circle Map Graphic Organizer. ... 2 Spider Map Graphic Organizer. ... 3 Idea Wheel Graphic Organizer. ... 4 Idea Web Graphic Organizer. ... 5 Concept Map Graphic Organizer.
What is the most effective graphic organizer?
Graphic Organizers That You Can Use in Your Class Circle Map. A circle map graphic organizer is used to explain related concepts or brainstorm ideas. ... Spider Map. This graphic organizer comes in handy when explaining things with descriptive connections. ... Idea Wheel. ... Venn Diagram. ... Tree Chart. ... Sequence of Events Chain.
What chart is used for compare and contrast?
A Venn diagram is one of the most well-known diagrams used to compare and contrast data. It's made up of multiple overlapping circles, each representing a set of data. The common elements between each set of data are represented by the areas of overlap within the circles.
What is the organizer used to compare two or more items?
In the classroom, the term “Venn diagram” is most often used to describe a specific type of graphic organizer that shows similarities and differences between two or more items.
What is the best graphic organizer for compare and contrast?
The best graphic organizers to compare and contrast are either the Venn diagram or the t-chart. The Venn diagram is better for comparisons of ideas but can get too cluttered in the overlapping area, while the t-chart is better if someone wanted to quickly contrast two topics.
Which of the following graphic organizers would be most appropriate to use for a compare and contrast text structure?
Venn Diagrams or T-charts are helpful graphic organizers regarding compare/contrast text structure.
Use professional pre-built templates to fill in and sign documents online faster. Get access to thousands of forms.
If you believe that this page should be taken down, please follow our DMCA take down process here.