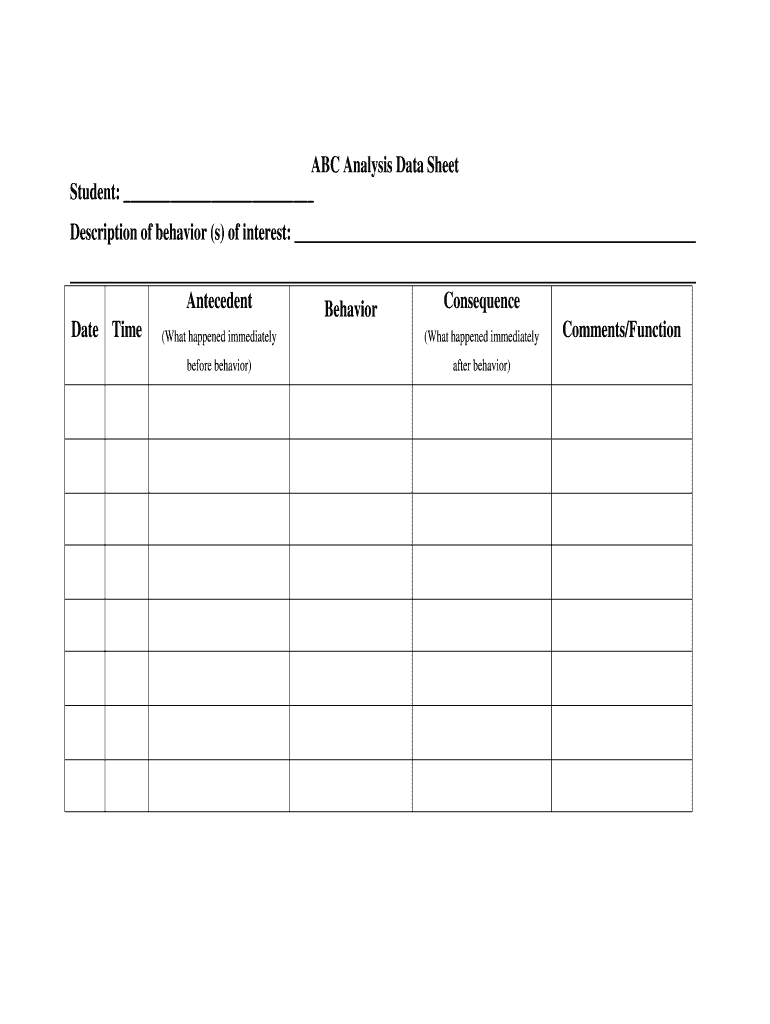
___________________________________________________ Antecedent Consequence Behavior Date Time (What happened immediately Comments/Function (What happened immediately before behavior) after behavior) Identify Function of Behaviors: -There are 4 main reasons for challenging behaviors to occur: 1. to escape or avoid an undesirable situation (ex. taking a test) 2. to get social attention (positive or negative) (ex. receiving a hug or a reprimand) 3. To gain access to a desired item/activity- (ex.

Open form follow the instructions

Easily sign the form with your finger

Send filled & signed form or save
How to fill out the ABC Analysis Data Sheet online
The ABC Analysis Data Sheet is a valuable tool for documenting behaviors of interest and understanding their underlying causes. This guide provides clear instructions on how to complete the form online, ensuring a comprehensive understanding of each section.
Follow the steps to accurately complete the ABC Analysis Data Sheet.
- Click ‘Get Form’ button to access the ABC Analysis Data Sheet and open it for editing.
- In the 'Student' field, clearly enter the name of the individual whose behavior you are analyzing. This should be a full name to ensure proper identification.
- In the 'Description of behavior(s) of interest' section, provide a detailed account of the specific behaviors you are observing. Be as descriptive as possible to capture the nuances of the behavior.
- For the 'Antecedent' section, record what immediately happened before the observed behavior occurred. This could include any instructions given or external factors influencing the situation.
- In the 'Behavior' field, clearly describe the behavior that was exhibited. Focus on observable actions that can be measured rather than internal thoughts or feelings.
- In the 'Consequence' section, document what happened immediately after the behavior took place. Note whether this reinforcement increased, decreased, or had no effect on the behavior.
- In the 'Date' and 'Time' fields, fill in the specific date and time when the observations were made to maintain an accurate record.
- Finally, in the 'Comments/Function' section, identify any functions of the behaviors based on the four main reasons for challenging behaviors: escape from undesirable situations, seeking attention, gaining access to desired items, or accessing sensory input.
- After completing all sections, review the information for accuracy, save your changes, and consider downloading or printing the document for your records.
Start filling out the ABC Analysis Data Sheet online today to effectively document and analyze behaviors.
Experience a faster way to fill out and sign forms on the web. Access the most extensive library of templates available.
Related content
Using the ABC model is an effective way to understand why a behavior happens. Being able...
ABC data is an assessment tool that involves directly observing and recording factors...
Mar 2, 2006 — STEP 6: MAROS ANALYSIS. MAROS analysis allows user to weight the trend...
Get answers to your most pressing questions about US Legal Forms API.
What is the ABC chart method?
The ABC chart method involves grouping items, tasks, or data into categories based on their importance or frequency of use. This strategy helps prioritize resources effectively, ensuring that you focus on the most impactful elements. Understanding and applying this method can lead to better resource allocation. The ABC Analysis Data Sheet available on US Legal Forms helps you implement this method seamlessly.
What is the ABC reporting format?
The ABC reporting format is a structured method for presenting analyzed data in a clear and concise manner. This format typically shows the items arranged by their priority, allowing for an easy overview of where to focus your efforts. Such a report aids decision-making and strategic planning. An ABC Analysis Data Sheet is an excellent tool to construct this reporting format efficiently.
How to fill out an ABC chart?
To fill out an ABC chart, start by listing the items or data points you want to analyze. Next, categorize them into groups A, B, and C based on their respective values or impacts. Finally, assign numerical values to represent their importance, ensuring you sum them up for clarity. Using an ABC Analysis Data Sheet from US Legal Forms simplifies this process, offering templates designed for ease of use.
What is the ABC chart format?
The ABC chart format is a visual representation that simplifies the categorization of items or data. It typically displays the items in a descending order based on their value or importance, helping users identify priorities easily. This format enhances clarity and allows for more strategic planning. Incorporating an ABC Analysis Data Sheet into your workflow can improve your comprehension of data trends.
What are ABC data sheets?
ABC data sheets are tools that provide structured information for analyzing different aspects of trading or inventory management. They are designed to categorize items or data points into three groups: A (most valuable), B (moderately valuable), and C (least valuable). This classification helps prioritize actions and resources effectively. You can create an ABC Analysis Data Sheet effortlessly on US Legal Forms to manage your data systematically.
What are the ABC's of charting?
The ABC's of charting refer to the fundamental components that make up a successful chart analysis. These components include understanding trends, identifying key levels of support and resistance, and recognizing various chart patterns. Mastering these basics allows you to make informed trading decisions. Utilizing an ABC Analysis Data Sheet can streamline this learning process by consolidating critical data into an easily digestible format.
How to present ABC analysis?
Presenting ABC analysis involves clearly articulating the findings using visual aids such as charts and tables. Start with an overview of the methodology, followed by an explanation of the categorized items. Utilizing an ABC Analysis Data Sheet visually outlines the important insights and guides discussion on inventory management strategies.
How to do an ABC data sheet?
To create an ABC data sheet, start by compiling a list of inventory items alongside their values or sales data. Sort the data in descending order, then calculate cumulative totals and percentages to categorize items into A, B, and C groups. An effective ABC Analysis Data Sheet will provide visibility into your inventory and help in strategic decision-making.
What is an ABC sheet?
An ABC sheet is a document that outlines the classification of inventory items based on their importance and contribution to overall value. It typically contains a list of items, their values, and their categorized status as A, B, or C. Using an ABC Analysis Data Sheet helps streamline inventory processes and ensures that you focus on high-impact items effectively.
How do you do an ABC chart?
To create an ABC chart, begin by organizing your inventory data based on each item’s value or usage frequency. Plot this data on a graph, identifying the A, B, and C categories, with A items shown prominently. Utilizing an ABC Analysis Data Sheet allows you to have a clear reference point, guiding decisions about stock levels and control measures.
Use professional pre-built templates to fill in and sign documents online faster. Get access to thousands of forms.
If you believe that this page should be taken down, please follow our DMCA take down process here.