Loading
Get The M M Not The Rapper Lab - New York Science Teacher
How it works
-

Open form follow the instructions
-

Easily sign the form with your finger
-

Send filled & signed form or save
How to fill out the The M M Not The Rapper Lab - New York Science Teacher online
This guide provides a clear, step-by-step approach to filling out The M M Not The Rapper Lab - New York Science Teacher form online. Users will find comprehensive instructions tailored to their needs, ensuring a smooth and efficient experience.
Follow the steps to accurately complete the form
- Click the ‘Get Form’ button to obtain the form and open it for completing.
- Begin by entering your name in the designated field. Make sure to write your full name as it appears in official documents.
- Next, fill in the date by selecting it from the calendar or entering it manually in the format MM/DD/YYYY.
- Indicate the period by selecting the relevant class period from the dropdown menu or entering it in the provided field.
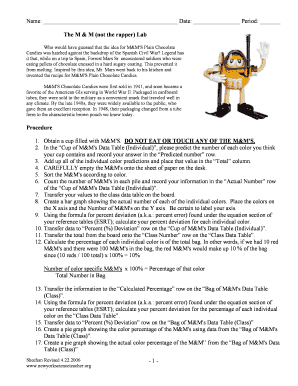
- Proceed to the 'Cup of M&M's Data Table (Individual)' section. Predict the number of each color M&M and document your predictions in the 'Predicted Number' row.
- After making your predictions, add the total of your predicted numbers and record this value in the 'Total' column.
- Carefully empty your M&Ms onto a flat surface, such as a sheet of paper. Ensure not to disturb the contents excessively.
- Sort the M&Ms by color and count each pile. Document the actual count in the 'Actual Number' row of the 'Cup of M&M's Data Table (Individual)'.
- Then, transfer your counts to the class data table displayed on the board, being sure to match the corresponding colors.
- Create a bar graph illustrating the actual count of each color, labeling the X-axis with color names and the Y-axis with the number of M&Ms.
- Calculate the percent deviation for each color using the provided formula and enter it in the 'Percent (%) Deviation' row.
- Record the class totals into the 'Class Number' row on the 'Class Data Table.'
- Calculate the percentage of each individual color relative to the total number of M&Ms, and input the results into the 'Calculated Percentage' row.
- Similar to earlier steps, calculate the percent deviation for the percentages and document it in the 'Percent (%) Deviation' row on the 'Bag of M&M's Data Table (Class)'.
- Construct two pie graphs to represent the color percentage of M&Ms, utilizing data from the 'Bag of M&M's Data Table (Class)'.
- Complete the form by saving the completed document. You can download a copy, print it for your records, or share it as necessary.
Complete the form online to engage with this science activity and enhance your understanding.
Industry-leading security and compliance
US Legal Forms protects your data by complying with industry-specific security standards.
-
In businnes since 199725+ years providing professional legal documents.
-
Accredited businessGuarantees that a business meets BBB accreditation standards in the US and Canada.
-
Secured by BraintreeValidated Level 1 PCI DSS compliant payment gateway that accepts most major credit and debit card brands from across the globe.