Loading
Get Sample Scatter Plot Form
How it works
-

Open form follow the instructions
-

Easily sign the form with your finger
-

Send filled & signed form or save
How to fill out the Sample Scatter Plot Form online
Filling out the Sample Scatter Plot Form online is a straightforward process that helps track and manage a child's behavioral incidents in an educational setting. This guide provides a step-by-step approach to ensure that users can complete the form accurately and efficiently.
Follow the steps to successfully fill out the Sample Scatter Plot Form.
- Click the ‘Get Form’ button to access the Sample Scatter Plot Form and open it in your online editor.
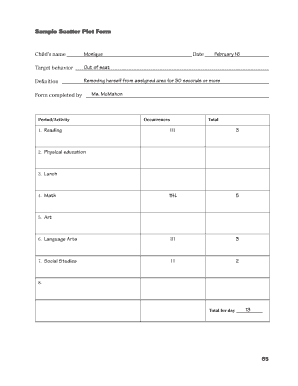
- Start by entering the child’s name in the designated field at the top of the form. Ensure that the name is spelled correctly to maintain accurate records.
- Next, input the date on which the incidents occurred. This provides context for tracking behavioral patterns over time.
- In the 'Target behavior' section, describe the specific behavior being monitored. For instance, you may write down 'removing themselves from assigned area for 30 seconds or more'.
- Define the target behavior in the designated 'Definition' field. This should provide clarity on what the behavior entails.
- Indicate who completed the form by entering their name in the 'Form completed by' section. This is crucial for accountability.
- Fill out each period or activity with the corresponding behaviors observed. This section allows for a breakdown of behavior by different activities throughout the day.
- Record the occurrences of the target behavior for each activity period. Use the provided fields to tally each incident accurately.
- Finally, total the occurrences for the day in the 'Total for day' field to summarize the child's behavior record.
- Once you have completed all sections, review the form for accuracy. You can then save your changes, download, print, or share the form as needed.
Begin filling out the Sample Scatter Plot Form online today to support effective behavior tracking.
A scatterplot is a type of data display that shows the relationship between two numerical variables. Each member of the dataset gets plotted as a point whose ( x , y ) (x, y) (x,y)left parenthesis, x, comma, y, right parenthesis coordinates relates to its values for the two variables.
Industry-leading security and compliance
US Legal Forms protects your data by complying with industry-specific security standards.
-
In businnes since 199725+ years providing professional legal documents.
-
Accredited businessGuarantees that a business meets BBB accreditation standards in the US and Canada.
-
Secured by BraintreeValidated Level 1 PCI DSS compliant payment gateway that accepts most major credit and debit card brands from across the globe.