Loading
Get Rubrics For Venn Diagram 2020-2026
How it works
-

Open form follow the instructions
-

Easily sign the form with your finger
-

Send filled & signed form or save
How to fill out the Rubrics For Venn Diagram online
Filling out the Rubrics For Venn Diagram is a straightforward process that allows users to effectively compare two objects using a visual representation. This guide provides a step-by-step approach to complete the rubric online, ensuring that all essential components are accurately filled.
Follow the steps to fill out the form accurately and efficiently.
- Click ‘Get Form’ button to obtain the form and open it in the editor.
- Begin by entering the student name in the designated space at the top of the form. This identifies the person completing the rubric.
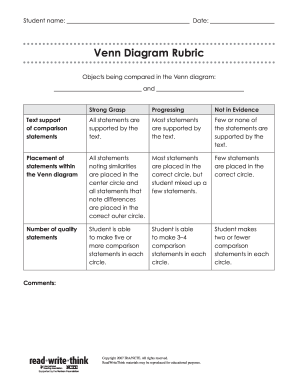
- In the section labeled 'Objects being compared in the Venn diagram,' list the two objects you wish to analyze. Ensure that both objects are clearly stated.
- Proceed to the 'Text support of comparison statements' section. For each category (Strong Grasp, Progressing, Not in Evidence), select the appropriate level of understanding based on the student's work, supporting your choice with text references where applicable.
- In the 'Placement of statements within the Venn diagram' section, determine the accuracy of statement placements. Make sure all similarities are noted in the center circle, while differences are placed accurately in the outer circles.
- Evaluate the 'Number of quality statements' by assessing the comparison statements made in each circle. Mark the corresponding level (five or more, 3-4, or two or fewer statements) that reflects the student's comparisons.
- Finally, add any additional comments in the comment section, providing further insights or feedback about the student's performance.
- Save your changes to the rubric once all fields are completed. You can also choose to download, print, or share the finalized form.
Complete your Rubrics For Venn Diagram online today to enhance your comparative analysis skills.
Calculating a Venn diagram involving two sets requires reviewing each area representing the distinct and shared data. Begin by counting unique elements in each set, then assess the intersection to account for shared members. This straightforward calculation can be made efficient by applying Rubrics for Venn Diagram, ensuring a logical approach to your data.