Loading
Get Use Of Graph 2020-2025
How it works
-

Open form follow the instructions
-

Easily sign the form with your finger
-

Send filled & signed form or save
How to fill out the Use Of Graph online
Filling out the Use Of Graph form online can streamline your data visualization efforts. This guide will assist you in navigating each section of the form to ensure you select the most appropriate graph type for your needs.
Follow the steps to effectively complete the Use Of Graph form.
- Click the ‘Get Form’ button to acquire the form and open it in your preferred editor.
- In the first section, enter your name in the designated field to identify your submission.
- Fill in the date, ensuring it reflects the current date when you are completing the form.
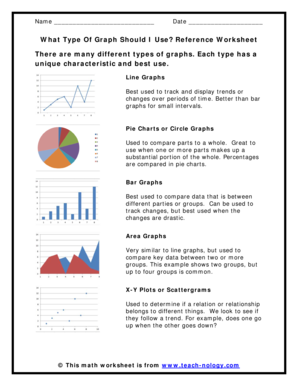
- Refer to the 'What Type Of Graph Should I Use?' section. Review the descriptions of each graph type: line graphs, pie charts, bar graphs, area graphs, and X-Y plots. Consider which type best fits your data needs.
- Select the type of graph that corresponds to your data by marking the appropriate option on the form.
- Once all necessary input has been entered and reviewed, you can save your changes, download a copy of the form, print it for your records, or share it as needed.
Complete your documents online today for efficient and effective data representation.
The uses of at chart can vary widely, but fundamentally they help in visualizing data clearly. These charts allow for easy understanding of time-based data or relationships among different variables. They serve not only to inform but also to engage viewers, making them useful in business, education, and research settings.
Industry-leading security and compliance
US Legal Forms protects your data by complying with industry-specific security standards.
-
In businnes since 199725+ years providing professional legal documents.
-
Accredited businessGuarantees that a business meets BBB accreditation standards in the US and Canada.
-
Secured by BraintreeValidated Level 1 PCI DSS compliant payment gateway that accepts most major credit and debit card brands from across the globe.