Loading
Get Usda Tr 55 Worksheet 4: Graphical Peak Discharge Method
How it works
-

Open form follow the instructions
-

Easily sign the form with your finger
-

Send filled & signed form or save
How to fill out the USDA Tr 55 Worksheet 4: Graphical Peak Discharge Method online
The USDA Tr 55 Worksheet 4 is an essential form used in hydrological analysis to estimate peak discharge from a drainage area. This guide provides a step-by-step approach to effectively fill out the worksheet online, ensuring accuracy and completeness.
Follow the steps to complete the form online with ease.
- Click ‘Get Form’ button to obtain the USDA Tr 55 Worksheet 4 and open it in your preferred editing tool.
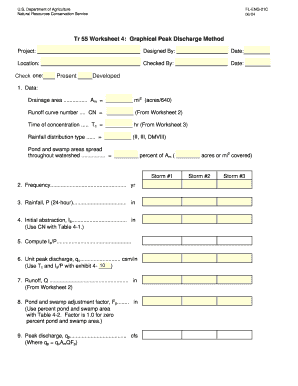
- Begin filling out the project details, including the project name, designer's name, date, location, and reviewer details. This information is critical for documentation and traceability.
- In the 'Data' section, specify the drainage area in square miles. You may convert acres to square miles by dividing the number of acres by 640.
- Next, input the runoff curve number (CN) taken from Worksheet 2 to evaluate the potential runoff based on land use and hydrologic conditions.
- Determine the time of concentration (Tc) in hours, referencing Worksheet 3, which is necessary for calculating the peak discharge.
- Select the appropriate rainfall distribution type by indicating either II, III, or DMVIII based on the geographical context of your project.
- Assess the pond and swamp areas within the watershed and report the percentage of the drainage area that they cover, including the respective area in acres or square miles.
- For storm data, input the frequency of storms in years and provide details for up to three storm events, including rainfall, initial abstraction, and any necessary calculations.
- Calculate and record the initial abstraction (Ia) based on the curve number using Table 4-1, then compute Ia/P for further analysis.
- Calculate the unit peak discharge (qu) using the time of concentration (Tc) and the Ia/P value, referring to the appropriate exhibit in your documentation.
- Input the runoff (Q) value obtained from Worksheet 2 and derive the pond and swamp adjustment factor (Fp) using Table 4-2, noting that the factor is 1.0 for zero percent pond and swamp areas.
- Finally, calculate the peak discharge (qp) using the formula qp = quAmQFp. Double-check your figures for accuracy.
- Once all sections are completed, you can save changes, download, print, or share the form for further processing.
Complete your USDA Tr 55 Worksheet 4 online today.
Yes, HydroCAD does incorporate TR-55 methodologies among its available hydrologic modeling options. This software allows users to apply the USDA Tr 55 Worksheet 4: Graphical Peak Discharge Method for analyzing peak discharge and managing site design. It is a valuable tool for engineers seeking detailed runoff calculations combined with the simplicity of TR-55 methods.