Get Scatter Plot Assessment Tool
How it works
-

Open form follow the instructions
-

Easily sign the form with your finger
-

Send filled & signed form or save
How to fill out the Scatter Plot Assessment Tool online
The Scatter Plot Assessment Tool is designed to help users effectively track and analyze behaviors over specified time intervals. This guide will provide you with a clear, step-by-step approach to filling out the form online, ensuring that you can complete it accurately and efficiently.
Follow the steps to complete the Scatter Plot Assessment Tool.
- Press the ‘Get Form’ button to access the form and open it in your chosen online editor.
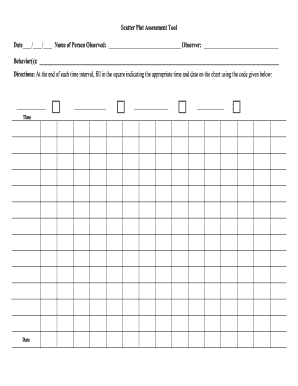
- Begin by entering the date in the designated field at the top of the form to ensure accurate tracking.
- In the 'Name of Person Observed' section, meticulously input the full name of the individual whose behavior you are analyzing.
- Next, fill in the 'Observer' field with your own name or the name of the individual completing the assessment.
- In the 'Behavior(s)' section, provide a detailed description of the behaviors you intend to monitor. This will guide your observations.
- At the end of each time interval, mark the corresponding square on the chart, ensuring you use the provided code for accuracy.
- After all observations are complete, utilize the options available to save your changes, download the filled form, print it for your records, or share it as needed.
Complete your Scatter Plot Assessment Tool online today to streamline your assessment process.
Filling out a scatter plot involves plotting data points for two variables on a graph. Begin by marking the x and y axes with your designated variables, and then place each data point accordingly. Ensuring the accuracy of each point is essential for an effective representation. With the help of our Scatter Plot Assessment Tool, this process can be streamlined for enhanced usability.