Loading
Get Graphing Categorical & Discrete Statistics Frequency Table 2012-2026
How it works
-

Open form follow the instructions
-

Easily sign the form with your finger
-

Send filled & signed form or save
How to fill out the Graphing Categorical & Discrete Statistics Frequency Table online
The Graphing Categorical & Discrete Statistics Frequency Table is a vital tool for organizing and presenting data effectively. This guide provides a straightforward, step-by-step approach to filling out the table online, ensuring that you can create a clear representation of your data.
Follow the steps to complete your frequency table with ease.
- Click ‘Get Form’ button to obtain the form and open it in the editor.
- Begin by entering the date in the designated field at the top of the form. This helps track when the data was collected.
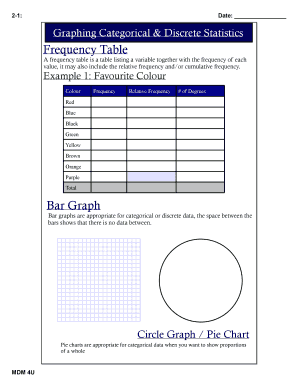
- Next, locate the section labeled 'Colour.' Here, you will input the different categories for your dataset, such as the colors in your survey.
- In the 'Frequency' column, enter the number of occurrences for each corresponding category. This represents how many times each color was selected.
- If applicable, fill in the 'Relative Frequency' column, which expresses the frequency as a proportion of the total. This provides insight into the distribution of responses.
- You may also include a 'Cumulative Frequency' section if you wish to display the running total of frequencies as you progress through the categories.
- After completing all necessary sections, review your entries for accuracy and completeness.
- Finally, you can save your changes, download the completed table, print it for physical records, or share it with others online.
Start filling out your Graphing Categorical & Discrete Statistics Frequency Table online today!
Frequency tables, pie charts, and bar charts are the most appropriate graphical displays for categorical variables.