Loading
Get Graphing With Your Ti
How it works
-

Open form follow the instructions
-

Easily sign the form with your finger
-

Send filled & signed form or save
How to fill out the Graphing With Your TI online
This guide provides clear and professional instructions on how to complete the Graphing With Your TI document. Whether you are familiar with graphing calculators or new to them, this user-friendly approach will support your needs.
Follow the steps to successfully fill out the Graphing With Your TI document.
- Click the 'Get Form' button to obtain the document and open it in your preferred editor.
- Familiarize yourself with the first tutorial content, which covers cleaning previous work and exploring the various screens of your calculator.
- Navigate to the Y= screen, where you will enter functions to graph. Make sure to clear any existing entries by selecting each line with the cursor and pressing CLEAR.
- Proceed to the Window screen to adjust the graph's dimensions. Use the up and down arrows to enter specific values for Xmin, Xmax, Ymin, and Ymax, ensuring they align with the expected ranges for your graph.
- Access the Graph Screen by pressing GRAPH to view the current graph of your entered functions based on the values set in the previous steps.
- Experiment with entering different functions in the Y= screen and utilize the TRACE tool to observe the graph's behavior at specific points.
- Utilize the Zoom menu to adjust your view of the graph, experimenting with different zoom options to see how they affect the visibility of key features.
- Continue following the tutorials for Linear Functions, Rational Functions, and Parabolic Functions, ensuring you perform the practice exercises at the end of each section to solidify your understanding.
- Once all necessary fields are completed and any changes are made, you can save your document, download it, print it, or share it as required.
Start filling out your Graphing With Your TI document online now to experience these features and enhance your graphing skills!
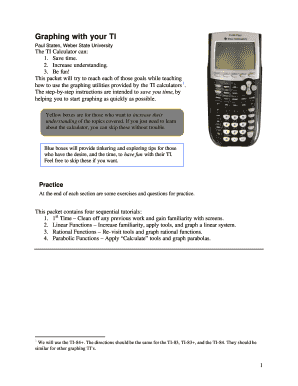
The first step in any graphing problem is to draw the graph. On the TI-83 and TI-84, this is done by going to the function screen by pressing the “Y=” button and entering the function into one of the lines. After the function has been entered, press the “GRAPH” button, and the calculator will draw the graph for you.
Industry-leading security and compliance
US Legal Forms protects your data by complying with industry-specific security standards.
-
In businnes since 199725+ years providing professional legal documents.
-
Accredited businessGuarantees that a business meets BBB accreditation standards in the US and Canada.
-
Secured by BraintreeValidated Level 1 PCI DSS compliant payment gateway that accepts most major credit and debit card brands from across the globe.