Loading
Get Ny Times Deficit Graphic 2010-2026
How it works
-

Open form follow the instructions
-

Easily sign the form with your finger
-

Send filled & signed form or save
How to fill out the NY Times Deficit Graphic online
This guide provides comprehensive instructions on how to effectively complete the NY Times Deficit Graphic online. By following these steps, you will be able to engage with the graphic and contribute to proposed budget changes succinctly and effectively.
Follow the steps to complete the NY Times Deficit Graphic.
- Press the ‘Get Form’ button to access the document and open it in your online editor.
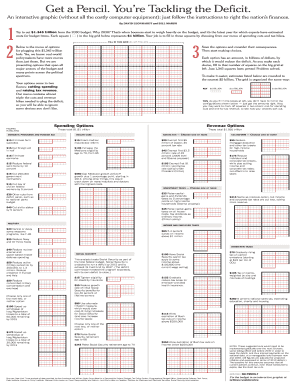
- Review the overall structure of the graphic. It contains a grid representing $1.345 trillion, with each square accounting for $1 billion. Your task will be to fill these squares by selecting options from the provided menu of spending cuts and tax increases.
- Examine the menu options divided into categories such as spending cuts and tax increases. Each action you take will influence the grid and aim to reach the goal of filling 1,345 squares.
- Select the options you wish to implement by marking the respective amounts in the grid. You can use different colors to differentiate between spending cuts and tax revenues as suggested in the graphic.
- Continue selecting and filling in the squares until you reach the total of $1.345 trillion. Ensure that all amounts correspond correctly by carefully checking your selections against the grid.
- Once you have finished filling out the grid, you can save your progress. Depending on the platform, you may have the option to download, print, or share your completed graphic.
Start your budget analysis today by filling out the NY Times Deficit Graphic online.
Related links form
The increase is largely the product of the Federal Reserve's aggressive raising of interest rates in a bid to tame inflation. Federal borrowing costs have climbed in recent weeks and stoked new concerns about interest payments — and larger deficits — in the years to come.