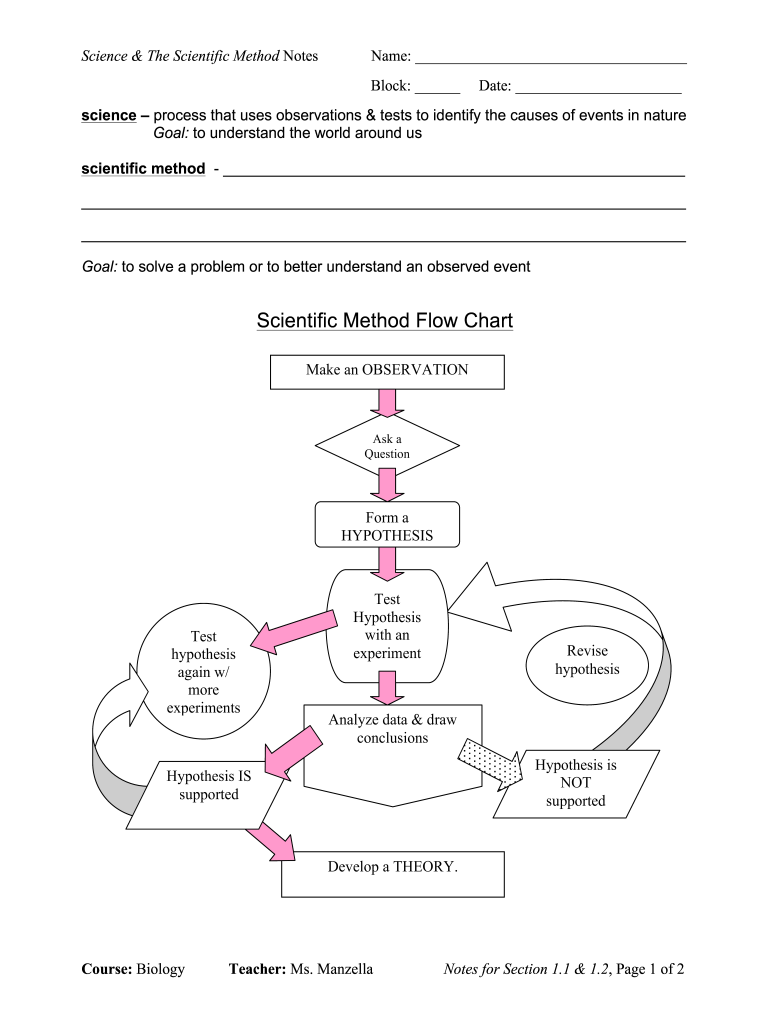
Ses of events in nature Goal: to understand the world around us scientific method - Goal: to solve a problem or to better understand an observed event Scientific Method Flow Chart Make an OBSERVATION Ask a Question Form a HYPOTHESIS Test hypothesis again w/ more experiments Test Hypothesis wi.
Loading

Open form follow the instructions

Easily sign the form with your finger

Send filled & signed form or save
How to fill out the NJ Lyndhurst Schools Scientific Method Flow Chart online
Filling out the NJ Lyndhurst Schools Scientific Method Flow Chart online is an essential step for students to understand and apply the principles of the scientific method in their studies. This guide provides clear and detailed instructions to help users navigate the process seamlessly.
Follow the steps to complete the Scientific Method Flow Chart effectively.
- Press the ‘Get Form’ button to access the NJ Lyndhurst Schools Scientific Method Flow Chart and open it for editing.
- Begin by entering your name in the designated field at the top of the form.
- In the block section, input your class block number using the numerical format.
- Record the current date in the designated date field.
- In the science definition section, describe the process of science using your own words to convey the concept of making observations and tests to identify causes in nature.
- State your understanding of the scientific method in the provided lines.
- Follow the flow chart step-by-step: start with making an observation, ask a question, and then proceed to form a hypothesis.
- For the hypothesis, use the space provided to articulate your initial hypothesis, ideally in an 'If... then...' format.
- Detail the variables in your experiment: identify and describe your manipulated (independent) variable, responding (dependent) variable, and controlled variables in the appropriate sections.
- After documenting your hypothesis and variables, move to record your data collection method in the section that prompts for data recording and analysis.
- Conclude your flow chart by forming a conclusion based on the data analysis and indicate whether your hypothesis was supported or not.
- Finally, save your completed flow chart, ensuring you keep a copy for your records, and consider printing or sharing it as necessary.
Start filling out your NJ Lyndhurst Schools Scientific Method Flow Chart online today!
Experience a faster way to fill out and sign forms on the web. Access the most extensive library of templates available.
Related content
Budgetary Basis -2016 Referendum - Improvement to Various Schools ... the District's...
Arch cohort is small, the students bring a diversity of backgrounds, experiences, and...
Apr 1, 2019 — THE SHIPPERS LISTED HAVE BEEN CERTIFIED BY REGULATORY AUTHORITIES IN THE...
Get answers to your most pressing questions about US Legal Forms API.
What is the correct flow of the scientific method?
Ask questions, make a hypothesis, test the hypothesis, analyze results, draw conclusions, communicate results.
What are the different steps involved in a scientific study show in a flow chart?
Basically, the scientific method consists of these steps: Make observations. Propose a hypothesis. Design and conduct and experiment to test the hypothesis. Analyze the results of the experiment to form a conclusion. Determine whether or not the hypothesis is accepted or rejected. State the results.
What is the correct order of steps in the scientific method?
Answer and Explanation: The correct sequence of the scientific method is: observations, questions, hypothesis, experiment, interpreting results, and making conclusions. One observes the environment, noticing intriguing occurrences, then asks a question(s).
What are the 8 steps of scientific method?
Problem. Observation. Hypothesis. Experiment. Collect Data. Analyze Results. Conclusion. Report findings.
What are the 7 steps to the scientific method?
There are seven steps to the scientific method: Question, Research, Hypothesis, Experiment, Data Analysis, Conclusion, and Communication. Although scientists may modify, reorder, or revisit steps on occasion, scientists generally use this basic logical approach.
What is the flow chart of scientific method?
The flowchart represents the real process of scientific inquiry. It shows that the process of science is not a linear recipe, but a non-linear, dynamic, and iterative process. It shows that: There are many routes into the process of science, like making a surprising observation.
Use professional pre-built templates to fill in and sign documents online faster. Get access to thousands of forms.
If you believe that this page should be taken down, please follow our DMCA take down process here.