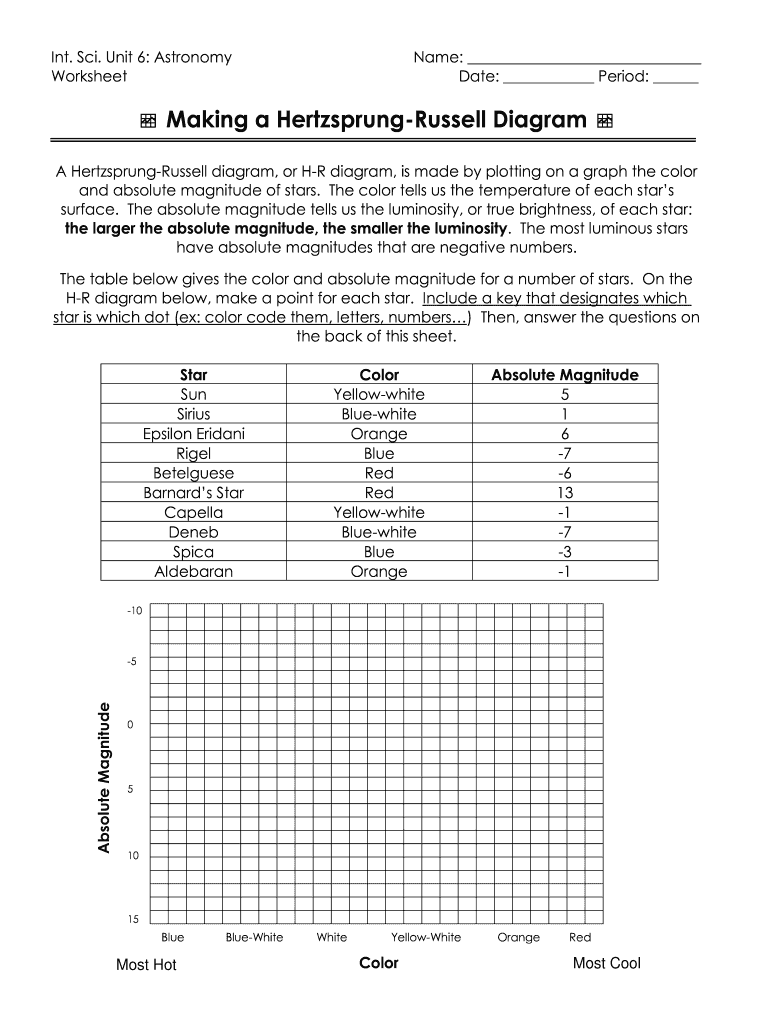
, is made by plotting on a graph the color and absolute magnitude of stars. The color tells us the temperature of each star’s surface. The absolute magnitude tells us the luminosity, or true brightness, of each star: the larger the absolute magnitude, the smaller the luminosity. The most luminous stars have absolute magnitudes that are negative numbers. The table below gives the color and absolute magnitude for a number of stars. On the H-R diagram below, make a point for each star. Include a .
Loading

Open form follow the instructions

Easily sign the form with your finger

Send filled & signed form or save
How to fill out the Trimble County Schools Making a Hertzsprung-Russell Diagram online
Creating a Hertzsprung-Russell diagram is an essential part of understanding stellar characteristics in astronomy. This guide provides detailed instructions for completing the Trimble County Schools Making a Hertzsprung-Russell Diagram form online.
Follow the steps to complete the form effectively.
- Press the ‘Get Form’ button to obtain the necessary form and display it in the designated editor.
- Fill in the personal information fields at the top of the form, including your name, date, and period.
- Review the provided star data table carefully, which includes information about each star's color and absolute magnitude.
- Using the data from the table, plot each star on the H-R diagram by marking a point for its color and absolute magnitude.
- Create a key that clearly identifies each plotted point on the diagram using a color code, letters, or numbers.
- Proceed to answer the questions located on the back of the form by providing detailed responses based on your understanding of the H-R diagram.
- After completing the form, ensure all information is accurate, then save your changes, download, print, or share the completed form as necessary.
Take the next step in your astronomy studies by completing your Trimble County Schools Making a Hertzsprung-Russell Diagram online today!
Experience a faster way to fill out and sign forms on the web. Access the most extensive library of templates available.
Related content
The Hertzsprung-Russell diagram, reproduced here from “Life Cycles of Stars”...
HR. Results plotted on a Hertzsprung-Russell (H-R) diagram, to further observe the trends...
called a Hertzsprung-Russell diagram (after the two astronomers EJNAR HERTZSPRUNG...
Get answers to your most pressing questions about US Legal Forms API.
What is the Hertzsprung-Russell diagram for kids?
For kids, the Hertzsprung-Russell diagram is a visual way to understand how stars change over time. It shows different types of stars, like bright giants and small white dwarfs, in a fun and colorful format. Engaging with Trimble County Schools Making a Hertzsprung-Russell Diagram makes this complex topic accessible and exciting for young learners.
Who gets credit for figuring out the HR diagram?
The Hertzsprung-Russell diagram is named after two astronomers: Ejnar Hertzsprung and Henry Norris Russell, who independently developed this concept in the early 20th century. Their work laid the groundwork for numerous discoveries in astronomy, making it easier to study the life cycle of stars. Trimble County Schools Making a Hertzsprung-Russell Diagram honors their contributions to science and education.
How can a Hertzsprung-Russell diagram help in learning about stars?
A Hertzsprung-Russell diagram is a powerful tool for learning about the characteristics and evolution of stars. It allows learners to visualize the relationship between brightness and temperature, enhancing their understanding of stellar life cycles. By incorporating Trimble County Schools Making a Hertzsprung-Russell Diagram into lessons, educators can provide a hands-on learning experience.
How to create an HR diagram?
To create a Hertzsprung-Russell diagram, first collect data on the stars you want to analyze. Plot the stars according to their temperature and luminosity on a grid, using temperature on the bottom axis and brightness on the side. Utilizing tools or resources from Trimble County Schools Making a Hertzsprung-Russell Diagram can simplify this process for students and educators.
What are the 4 main categories on the HR diagram?
The Hertzsprung-Russell diagram generally includes four main categories: main sequence stars, giants, supergiants, and white dwarfs. Each category represents a different stage in a star's life cycle, showcasing variations in brightness and temperature. Understanding these categories is essential when exploring Trimble County Schools Making a Hertzsprung-Russell Diagram.
How to make a H-R diagram?
Creating a Hertzsprung-Russell diagram begins by gathering data on stars, including their brightness and temperature. You can then plot this data on a graph, with temperature on the horizontal axis and brightness on the vertical axis. Trimble County Schools Making a Hertzsprung-Russell Diagram can be an engaging way to visually represent the life stages of stars.
What information is required to locate a star on the H-R diagram?
Locating a star on the Hertzsprung-Russell diagram requires its luminosity and effective temperature. The luminosity indicates how bright the star appears, while the effective temperature helps establish its color and position along the temperature scale. For students at Trimble County Schools making a Hertzsprung-Russell diagram, following these steps ensures you accurately place each star on the diagram.
How to plot stars on the H-R diagram?
To plot stars on the Hertzsprung-Russell diagram, first, collect the luminosity and temperature data for the stars you are studying. Use a graphing tool to create a two-dimensional plot, placing temperature on the horizontal axis and luminosity on the vertical axis. If you are part of Trimble County Schools making a Hertzsprung-Russell diagram, resources are available to help you visualize these data points effectively.
What are the three main details stars are plotted on HR diagrams for?
Stars are mainly plotted on the Hertzsprung-Russell diagram based on three critical details: luminosity, temperature, and spectral class. These details help astronomers categorize stars and understand their stages of evolution. At Trimble County Schools making a Hertzsprung-Russell diagram, exploring these classifications can enhance your learning experience dramatically.
What information is needed to plot a star on the H-R diagram?
To plot a star on the Hertzsprung-Russell diagram, you need two essential pieces of information: the star's absolute magnitude and its surface temperature. The surface temperature can often be determined from the star's color or spectral type. Additionally, if you are associated with Trimble County Schools making a Hertzsprung-Russell diagram, it is beneficial to have your star's luminosity for accurate plotting.
Use professional pre-built templates to fill in and sign documents online faster. Get access to thousands of forms.
If you believe that this page should be taken down, please follow our DMCA take down process here.