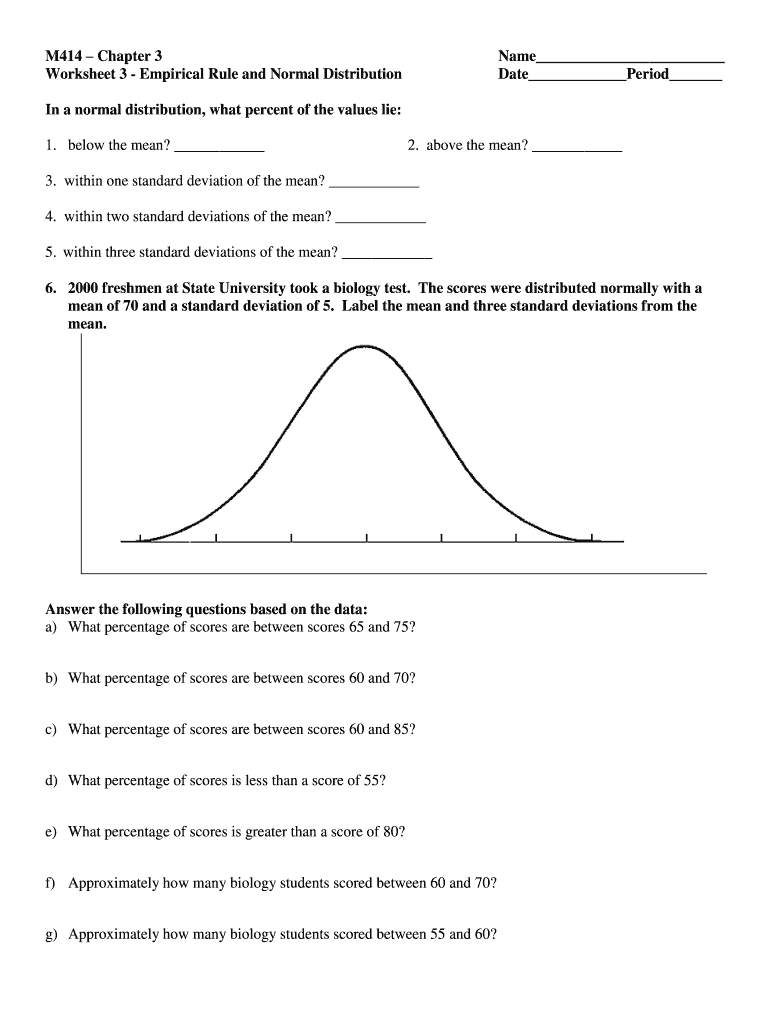
M414 Chapter 3 Worksheet 3 Empirical Rule and Normal Distribution Name Date Period In a normal distribution, what percent of the values lie: 1. below the mean? 2. above the mean? 3. within one standard.

Open form follow the instructions

Easily sign the form with your finger

Send filled & signed form or save
How to fill out the M414 Chapter 3 Worksheet 3 online
Filling out the M414 Chapter 3 Worksheet 3 requires careful attention to detail and an understanding of normal distribution concepts. This guide will provide step-by-step instructions to help you complete the form accurately and efficiently.
Follow the steps to successfully complete the form.
- Press the ‘Get Form’ button to access the worksheet and open it in the online editor.
- Begin by entering your name in the designated field at the top of the form.
- Next, fill in the date and period in the corresponding fields to indicate when the worksheet is being completed.
- For questions about percentages in a normal distribution, provide the appropriate values in the fields presented, specifying the percentage below the mean, above the mean, and within specified standard deviations.
- For each data set provided (for example, the students' test scores), carefully analyze the statistics and calculate answers for the related questions, recording your answers in the provided spaces.
- Once all questions have been answered, review your entries to ensure accuracy and completeness.
- Finally, save your changes, and choose to download, print, or share the completed form as required.
Complete your document online for efficiency and accuracy.
Experience a faster way to fill out and sign forms on the web. Access the most extensive library of templates available.
Related content
For Year 3, therefore, the Cascade Corporation and the Starr Corporation are part of an...
AFRO-A 169 Introduction to African American Literature (3 cr.) ... the student to...
Get answers to your most pressing questions about US Legal Forms API.
What percentage of scores are between scores 60 and 70?
scored between 60 and 70? 13.5+ 34=47.5%.
What percent of the SAT scores fall between 500 and 600?
Answer: The mean SAT score is 500. 68% of students score between 500–100=400 and 500+100=600. The remaining 32% score outside of this range. So (16+34+34)% = 84% score 600 or lower.
What percent of students SAT scores fall between 400 and 600?
Answer and Explanation: About 68% of the students scored between 400 and 600.
What percentage of SAT scores are above 400?
So 68% + 16% = 84% of SAT scores are above 400. (b) What percentage of SAT scores are above 500? Since 500 is the median, 50% of SAT scores are above it.
What percentage of scores are between 65 and 75?
So because of symmetry 50% of the test scores fall in the area above the mean and 50% of the test scores fall in the area below the mean. We know from part b that the percentage from 65 to 75 is 47.5%.
How many students scored within 1 standard deviation of the mean?
Empirical Rule or 68-95-99.7% Rule Approximately 68% of the data fall within one standard deviation of the mean. Approximately 95% of the data fall within two standard deviations of the mean. Approximately 99.7% of the data fall within three standard deviations of the mean.
What proportion has SAT scores less than 400?
The proportion of students with SAT scores less than 400 is approximately 0.1587. b. The proportion of students with SAT scores greater than 650 is approximately 0.0918.
What percentage of students would be expected to score between 400 and 590?
Expert-Verified Answer. Using the normal distribution, it is found that 58.97% of students would be expected to score between 400 and 590.
Use professional pre-built templates to fill in and sign documents online faster. Get access to thousands of forms.
If you believe that this page should be taken down, please follow our DMCA take down process here.