Loading
Get Student Exploration Elevator Operator Answer Key
How it works
-

Open form follow the instructions
-

Easily sign the form with your finger
-

Send filled & signed form or save
How to fill out the Student Exploration Elevator Operator Answer Key online
This guide provides a clear and supportive framework for filling out the Student Exploration Elevator Operator Answer Key online. By following the steps outlined below, users can efficiently complete the form with ease.
Follow the steps to fill out the form accurately.
- Click the ‘Get Form’ button to access the Student Exploration Elevator Operator Answer Key and open it in your preferred online editor.
- Begin by entering your name in the designated field at the top of the form. This section requires the name of the user filling out the answer key.
- Next, enter the date in the provided space to document when the form is completed. Ensure you use the correct format as specified.
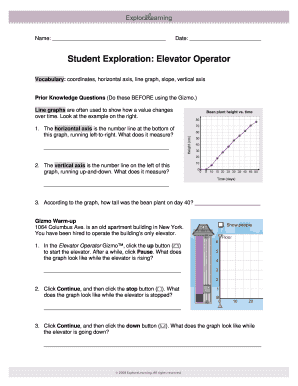
- Proceed to the vocabulary section. Here, users may need to reference or define the listed terms, such as coordinates, horizontal axis, line graph, slope, and vertical axis.
- Answer the prior knowledge questions based on the graphs and information available. Ensure that you provide concise and accurate responses to questions related to the horizontal and vertical axes.
- For the Gizmo warm-up and activities, follow the prompts to input your observations and findings. Make sure to document the indicated points and coordinate values.
- As you complete each activity, ensure that all graphs and sketches are clearly labeled according to the instructions provided in the task.
- Once all sections have been filled out, review your answers for accuracy. Make any necessary edits as needed.
- Finally, save your changes, and choose to download, print, or share the completed answer key as necessary.
Complete your Student Exploration Elevator Operator Answer Key online today for a smooth and efficient experience.
Line with a negative slope represents elevator going down. Horizontal line represents elevator at rest. Steeper lines represent faster motion.