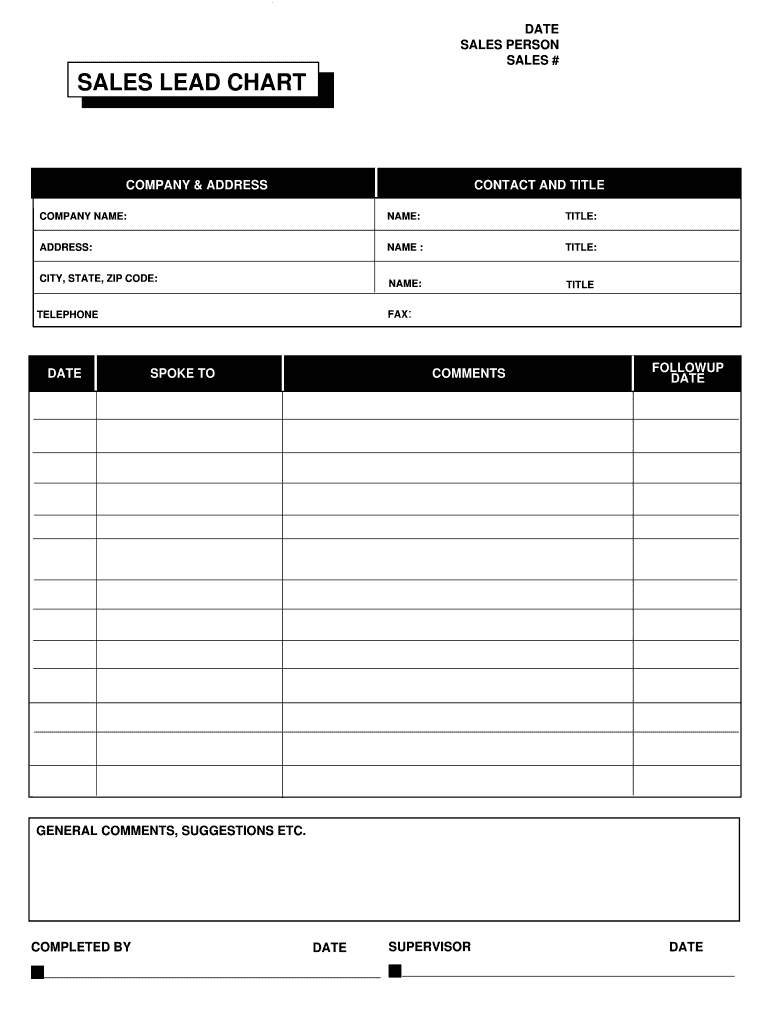
DATE SPOKE TO COMMENTS FOLLOWUP DATE GENERAL COMMENTS, SUGGESTIONS ETC. COMPLETED BY DATE SUPERVISOR DATE .

Open form follow the instructions

Easily sign the form with your finger

Send filled & signed form or save
How to fill out the Sales Lead Chart online
The Sales Lead Chart is a vital tool for capturing and managing sales leads effectively. This guide provides clear, step-by-step instructions on how to accurately fill out each section of the chart online to optimize your sales tracking.
Follow the steps to correctly complete the Sales Lead Chart.
- Click the ‘Get Form’ button to access the Sales Lead Chart and open it for editing.
- Begin by entering the date in the designated field at the top of the form. This indicates when the lead was created.
- In the 'Sales Person' field, provide the name of the individual responsible for managing this sales lead.
- Fill in the 'Sales No.' section by assigning a unique identification number for the lead, which will help in tracking.
- Complete the 'Company & Address' section with the full name of the company, along with the address, including city, state, and ZIP code.
- In the 'Contact and Title' section, input the names and titles of the key contacts within the company.
- Record the telephone number and fax number of the company to maintain communication.
- Indicate the date you last spoke to the contact under the 'Spoke To' section.
- Add any relevant comments, suggestions, or notes in the 'Comments' section to provide context or additional information about the lead.
- Set a follow-up date in the designated field to ensure timely communication with the lead.
- Use the 'General Comments, Suggestions, etc.' section for any other information that might be helpful for future reference.
- Fill in your name in the 'Completed By' section, indicating who is responsible for this entry on the form.
- Lastly, record the date of your completion and ensure the supervisor’s details are also filled out.
- Once all sections are completed, save your changes. You may also choose to download a copy, print the document, or share it with relevant parties.
Start completing your Sales Lead Chart online today for efficient sales management!
Experience a faster way to fill out and sign forms on the web. Access the most extensive library of templates available.
Related content
by M Wu · 2023 · Cited by 33 — This study aims to review and analyze the existing...
May 15, 2025 — SELECT THE CHART FORM. (from comparison to chart). Each comparison will...
Jul 20, 2025 — This episode is for operators looking to build trust at scale, reduce...
Get answers to your most pressing questions about US Legal Forms API.
How do you track sales leads?
You can track sales leads through effective data management and organization. By capturing lead details in a dedicated document, such as Excel, you can easily monitor follow-ups and conversions. Leveraging a Sales Lead Chart can be an effective way to visualize your progress, helping you maintain focus on your sales goals.
How to create a spreadsheet to track sales?
Creating a spreadsheet to track sales begins with setting up a new Excel document and defining your columns, such as date, sale amount, and lead details. Populate your spreadsheet with sales data regularly for accurate tracking. Utilizing a structured format can enhance your ability to derive insights from your Sales Lead Chart.
How to make a sales graph in Excel?
Making a sales graph in Excel is a straightforward process. First, input your sales data into your workbook, and highlight the relevant entries. Then, go to the 'Insert' tab and select the type of graph you prefer, ensuring it accurately represents your data. This sales graph can complement your Sales Lead Chart, making information easier to digest.
How to create a sales chart in Excel?
To create a sales chart in Excel, enter your sales data in a spreadsheet and select the range you want to visualize. Navigate to the 'Insert' tab and choose the appropriate chart type that reflects your data, such as a bar or line chart. This visual representation will create a Sales Lead Chart that helps you communicate your sales trends effectively.
How to create a sales lead list?
Creating a sales lead list involves researching potential leads in your industry or target markets. You can collect contact details and relevant data, and format this information into a structured document. By organizing your sales lead list, you lay the groundwork for developing an impactful Sales Lead Chart to track your outreach efforts.
How to create a sales dashboard in Excel?
To create a sales dashboard in Excel, first gather your sales data and layout your dashboard elements on a new worksheet. Incorporate charts, pivot tables, and key performance indicators relevant to your sales leads. A well-designed sales dashboard provides a visual representation of trends and helps you utilize the Sales Lead Chart effectively for better decisions.
How do I create a sales sheet in Excel?
Creating a sales sheet in Excel starts with opening a new workbook. You should input your sales data in a tabular format, including columns for the sales lead name, contact information, and status. Once you enter your data, use Excel functions to organize and analyze it, which will facilitate creating a Sales Lead Chart that highlights your sales performance.
How do you calculate sales leads?
Calculating sales leads involves analyzing your Sales Lead Chart to track conversion rates, lead sources, and engagement metrics. By assessing this data, you can determine how many leads convert into customers over a specific period. This information is crucial for understanding your sales process's effectiveness and identifying areas for improvement.
How to keep track of sales leads?
To keep track of sales leads, leverage a reliable Sales Lead Chart that allows you to update status, notes, and follow-up schedules consistently. Regularly reviewing this chart helps ensure that no lead falls through the cracks and that your team remains focused on nurturing potential customers. Utilizing platforms like uslegalforms can further enhance your ability to manage your leads seamlessly.
How do you find sales leads?
Finding sales leads requires using a combination of research and digital tools, including a well-structured Sales Lead Chart. Use online platforms, social media, and networking events to gather potential contacts. By documenting and evaluating these leads in your chart, you will streamline your efforts and maintain focus on high-potential prospects.
Use professional pre-built templates to fill in and sign documents online faster. Get access to thousands of forms.
If you believe that this page should be taken down, please follow our DMCA take down process here.