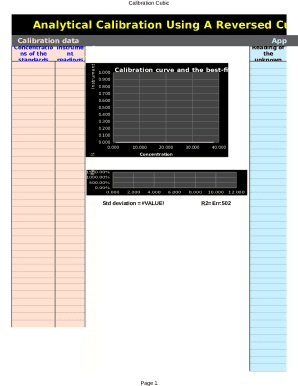
Calibration CubicAnalytical Calibration Using A Reversed Cub Calibration dataR e s d u a lsInstrument readingConcentratio Instrume ns of the nt Y 3 standards readingsY 2 ### ### 0 0 1.000 Calibration.
Open form follow the instructions
Easily sign the form with your finger
Send filled & signed form or save
How to fill out the Analytical Calibration Form online
Filling out the Analytical Calibration Form online is a straightforward process. This guide provides clear instructions on each section of the form, ensuring that you understand how to complete it accurately and efficiently.
Follow the steps to complete the Analytical Calibration Form.
- Click ‘Get Form’ button to obtain the Analytical Calibration Form and open it in your preferred digital editor.
- Begin with the calibration data section. Enter the instrument reading and the corresponding concentration values for the calibration standards. Make sure the readings are accurately transcribed from your equipment.
- In the residual calculations section, include the readings of the standards. This data is essential for analyzing the performance of your calibration curve.
- Next, provide the predicted concentrations based on your readings. This will help to assess any discrepancies observed during calibration.
- In the uncertainty calculations area, input the instrument reading uncertainties along with calculated concentration uncertainties to ensure that all potential errors are documented.
- Review all fields to ensure accuracy and completeness. Look for any potential errors in your entries before finalizing the form.
- Once you have thoroughly reviewed the form, you can save your changes. You may also choose to download, print, or share the completed form as necessary.
Start filling out the Analytical Calibration Form online today to ensure your calibration data is accurately recorded.
Experience a faster way to fill out and sign forms on the web. Access the most extensive library of templates available.
Related content
alternate analysis, makes the calibration only a single component in the evaluation...
width of the working range and the shape of the calibration curve, and should insure the...
Malvern Panalytical provide a range of material analysis solutions and ... the measurement...
Get answers to your most pressing questions about US Legal Forms API.
What is the calibration curve equation?
The calibration curve is a plot of instrumental signal vs. concentration. The plot of the standards should be linear, and can be fit with the equation y=mx+b.
What is calibration function?
The calibration function is defined as the functional (not statistical) relationship for the. CMP, relating the expected value of the observed signal or response variable E(y) to. the analyte amount x. The corresponding graphical display for a single analyte is. referred to as the calibration curve.
What is meant by calibration?
Formally, calibration is the documented comparison of the measurement device to be calibrated against a traceable reference device. The reference standard may be also referred as a calibrator. Logically, the reference is more accurate than the device to be calibrated.
What is calibration in analytical chemistry?
In analytical chemistry, calibration is defined as the process of assessment and refinement of the accuracy and precision of a method, and particularly the associated measuring equipment (i.e., an instrument), employed for the quantitative determination of a sought-after analyte [2].
What is a good R squared value?
While for exploratory research, using cross sectional data, values of 0.10 are typical. In scholarly research that focuses on marketing issues, R2 values of 0.75, 0.50, or 0.25 can, as a rough rule of thumb, be respectively described as substantial, moderate, or weak.
What is r2 in calibration curve?
The r or r2 values that accompany our calibration curve are measurements of how closely our curve matches the data we have generated. The closer the values are to 1.00, the more accurately our curve represents our detector response. Generally, r values 0.995 and r2 values 0.990 are considered 'good'.
What is a calibration equation?
In the calibration curve method, a series of external standard solutions is prepared and measured. A line or curve is fit to the data and the resulting equation is used to convert readings of the unknown samples into concentration. ... The model equation is A = slope * C + intercept.
How do you calculate calibration?
The equation will be of the general form y = mx + b, where m is the slope and b is the y-intercept, such as y = 1.05x + 0.2. Use the equation of the calibration curve to adjust measurements taken on samples with unknown values.
How do you calculate calibration curve?
The equation will be of the general form y = mx + b, where m is the slope and b is the y-intercept, such as y = 1.05x + 0.2. Use the equation of the calibration curve to adjust measurements taken on samples with unknown values. Substitute the measured value as x into the equation and solve for y (the true value).
What is the purpose of the R2 value on a standard curve?
R-squared is a statistical measure of how close the data are to the fitted regression line. It is also known as the coefficient of determination, or the coefficient of multiple determination for multiple regression. 0% indicates that the model explains none of the variability of the response data around its mean.
Use professional pre-built templates to fill in and sign documents online faster. Get access to thousands of forms.
If you believe that this page should be taken down, please follow our DMCA take down process here.