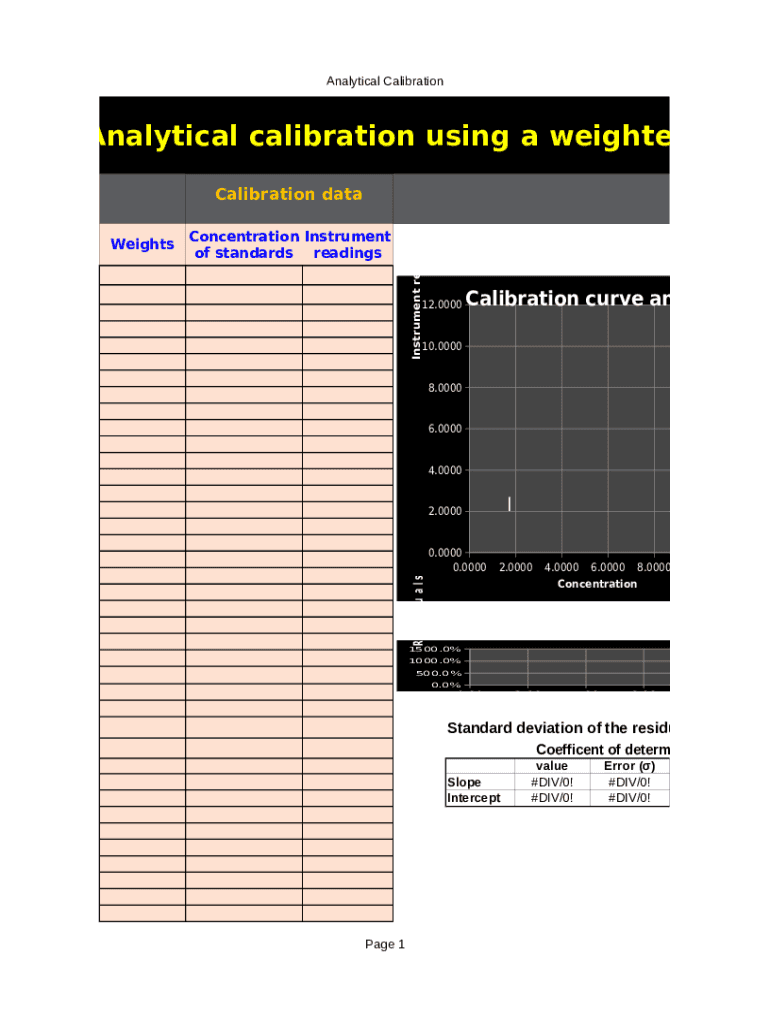
Analytical CalibrationAnalytical calibration using a weighted lineaConcentration Instrument of standards readings12.0000Calibration curve and the bes10.00008.00006.00004.00002.00000.0000 0.00002.00004.0000.

Open form follow the instructions

Easily sign the form with your finger

Send filled & signed form or save
How to fill out the Calibration Linear Weighted online
This guide provides users with comprehensive, step-by-step instructions on how to fill out the Calibration Linear Weighted form online. Whether you are new to this process or need a refresher, our expert tips will help you navigate the form with ease.
Follow the steps to successfully complete the form.
- Click the ‘Get Form’ button to access the Calibration Linear Weighted document and open it in the editor.
- Review the introduction section. Ensure you understand the purpose of the form and the parameters involved in the calibration process.
- Locate the section for entering concentration values. Input the specific values as required by aligning them with the respective instrument readings.
- Fill out the calibration curve data accurately, ensuring that the best-fit line is represented correctly based on your results.
- Input any necessary calculations, including the standard deviation of the residuals and the coefficient of determination, ensuring no fields are left blank.
- Check the residual calculations and complete any associated fields that may request values based on your entries.
- Once all fields are completed, review your entries for accuracy. Make any necessary adjustments before proceeding.
- After confirming all information is correct, save your changes. You can then choose to download, print, or share the completed form.
Complete your Calibration Linear Weighted form online today for accurate results.
Experience a faster way to fill out and sign forms on the web. Access the most extensive library of templates available.
Related content
by H Gu · 2014 · Cited by 104 · Related articlesA simple procedure for...
by PS Kott · Cited by 2 · Related articlesAs with the expansion estimator, the...
In statistics, the Gauss–Markov theorem states that the ordinary least squares (OLS)...
Get answers to your most pressing questions about US Legal Forms API.
What is a calibration equation?
In the calibration curve method, a series of external standard solutions is prepared and measured. A line or curve is fit to the data and the resulting equation is used to convert readings of the unknown samples into concentration. ... The model equation is A = slope * C + intercept.
Why are calibration curves linear?
Calibration curves are used to understand the instrumental response to an analyte, and to predict the concentration of analyte in a sample. ... The linear portion of this plot can then be used to predict the concentration of a sample of the analyte, by correlating its response to concentration.
How do you do a linear calibration curve?
Excel has built-in features that you can use to display your calibration data and calculate a line-of-best-fit. ... Let's start by selecting the data to plot in the chart. ... Advertisement. ... Go to the Insert tab. Navigate to the Charts menu and select the first option in the Scatter drop-down.
What is linear range of a calibration curve?
Linear range or linear dynamic range The range of concentrations where the signals are directly proportional to the concentration of the analyte in the sample.
What is the calibration curve equation?
The calibration curve is a plot of instrumental signal vs. concentration. The plot of the standards should be linear, and can be fit with the equation y=mx+b.
Why do calibration curves deviate from a straight line?
Calibration curves absorbance versus concentration may deviate from a straight line when A<0.1 and when A>1 maybe because at these values the substances react to light differently which will cause it to not follow a linear graph.
How do you calculate calibration?
The equation will be of the general form y = mx + b, where m is the slope and b is the y-intercept, such as y = 1.05x + 0.2. Use the equation of the calibration curve to adjust measurements taken on samples with unknown values.
Why should a calibration curve be linear?
ABSTRACT: I propose that calibration curves known to be reliably linear are important because they obviate the need to prepare a curve each time a method is applied. ... Single point calibration saves time, uses less reference substance and facilitates drift detection and correction.
What does a linear calibration curve mean?
Calibration curve in bioanalytical method is a linear relationship between concentration (independent variable) and response (dependent variable) using a least squares method. This relationship is built to predict the unknown concentrations of the analyte in a complicated matrix.
What is linearity in calibration?
Linearity is an important and desirable feature of an analytical method. For example, if a calibration function is linear, then it is easier to estimate the equation, and evaluation errors (errors in estimating unknown concentrations from the calibration function) are likely to be smaller.
Use professional pre-built templates to fill in and sign documents online faster. Get access to thousands of forms.
If you believe that this page should be taken down, please follow our DMCA take down process here.