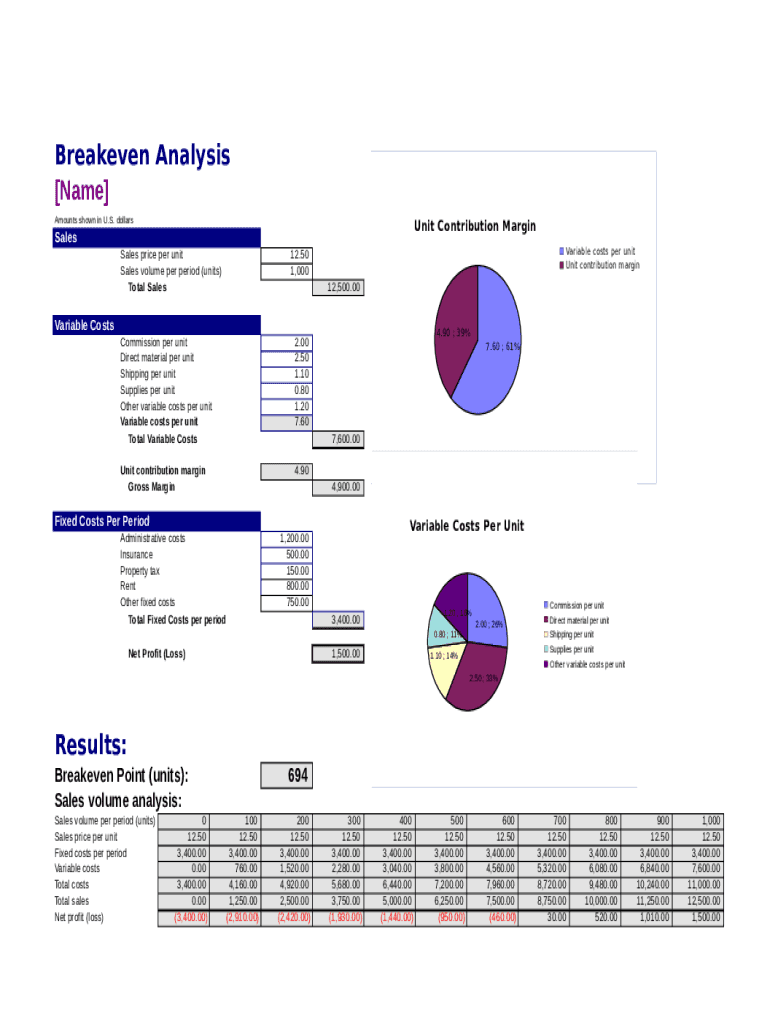
Breakeven Analysis Name Amounts shown in U.S. dollarsUnit Contribution MarginSales Sales price per unit Sales volume per period (units) Total SalesVariable costs per unit Unit contribution margin12.50 1,000 12,500.00Variable.

Open form follow the instructions

Easily sign the form with your finger

Send filled & signed form or save
How to fill out the Breakeven Analysis Template online
The breakeven analysis template is a valuable tool for understanding your business's financial dynamics. This guide provides clear, step-by-step instructions on how to complete the template online, ensuring you can accurately assess your breakeven point and make informed decisions.
Follow the steps to effectively fill out the Breakeven Analysis Template
- Click ‘Get Form’ button to access the breakeven analysis template and open it in your preferred online editor.
- Begin by entering the sales price per unit. This is the amount at which you intend to sell each unit of your product or service.
- Next, fill in the sales volume per period in units. This field indicates how many units you anticipate selling in a specific timeframe.
- Calculate total sales by multiplying the sales price per unit by the sales volume. Input this amount in the total sales field.
- List your variable costs per unit, including commission, direct material, shipping, supplies, and other costs. Enter these amounts in the respective fields.
- Sum all variable costs to determine the total variable costs and record this figure.
- Calculate the unit contribution margin by subtracting total variable costs from the sales price per unit. Make sure to enter this value.
- Document your fixed costs per period, which may include administrative costs, insurance, property tax, rent, and any other fixed expenses.
- Analyze the results section by determining the breakeven point in units based on your inputs. Review your sales volume analysis as needed.
- Once all fields are complete and accurate, save your changes. Depending on your needs, you may download, print, or share the finalized breakeven analysis template.
Get started on your breakeven analysis today by filling out the template online!
Experience a faster way to fill out and sign forms on the web. Access the most extensive library of templates available.
Related content
VOLUME 4, CHAPTER 3, ANNEX 2: “EXTENT OF COLLECTION EFFORTS. DETERMINATION FOR DOMESTIC...
56, includes ten data points on either side of the break-even/target-profit. 57, point...
Case analysis is an essential part of a strategic man- agement course and ... innovation...
Get answers to your most pressing questions about US Legal Forms API.
How do you write a break-even analysis?
How to calculate your break-even point When determining a break-even point based on sales dollars: Divide the fixed costs by the contribution margin. ... Break-Even Point (sales dollars) = Fixed Costs ÷ Contribution Margin. Contribution Margin = Price of Product – Variable Costs.
How do you write a break-even chart?
To draw a break-even chart, we need to follow six steps: draw axes; draw a line indicating fixed costs; draw a line indicating variable costs; draw a line indicating total costs; draw a line indicating revenue; mark the break-even point.
How do I do a break-even analysis on Excel?
How to Calculate Break-Even Points in Excel? Step 1: We should enter the formula as Total Cost = (Fixed + Other) + (Variable * Units). ... Step 2: To find the sales value, we must enter one more formula, i.e., Units * Sale Value. Step 3: Now, enter the formula for BEP, i.e., Sale Value – Total Cost.
What is an example of break-even?
For example, the break-even price for selling a product would be the sum of the unit's fixed cost and variable cost incurred to make the product. Thus if it costs $20 total to produce a good, if it sells for $20 exactly, it is the break-even price.
What is an example of break-even analysis for a product?
Your Break-even Formula For example, if your fixed expenses are $10,000 and you sell a product for $100 that has a per-unit variable cost of $45, you would perform this calculation: 10,000 divided by (100 minus 45). This comes to 181.81 products, which you can round up to 182 products you must sell to break even.
How do you set up a break-even analysis?
How to calculate your break-even point When determining a break-even point based on sales dollars: Divide the fixed costs by the contribution margin. ... Break-Even Point (sales dollars) = Fixed Costs ÷ Contribution Margin. Contribution Margin = Price of Product – Variable Costs.
Does Excel have a break-even analysis template?
Break-Even Analysis is a ready-to-use template in Excel, Google Sheets, OpenOffice, and Apple Numbers to calculate financial feasibility for launching a new product or starting new ventures.
Use professional pre-built templates to fill in and sign documents online faster. Get access to thousands of forms.
If you believe that this page should be taken down, please follow our DMCA take down process here.