Loading
Get Box Plots Template
How it works
-

Open form follow the instructions
-

Easily sign the form with your finger
-

Send filled & signed form or save
How to fill out the Box Plots Template online
The Box Plots Template is a valuable tool for visualizing data distributions. This guide provides step-by-step instructions on how to complete the template online effectively.
Follow the steps to fill out the Box Plots Template online.
- Click the ‘Get Form’ button to obtain the Box Plots Template and open it in your preferred online editor.
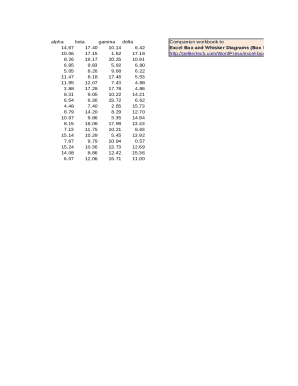
- Begin by entering the data sets under the appropriate headings, such as alpha, beta, gamma, and delta. Each data set should be input into its corresponding field.
- Review the statistical calculations that follow the data input fields. These typically include count, mean, standard deviation (SD), minimum (Min), first quartile (Q1), median, third quartile (Q3), and maximum (Max). Ensure that these calculations are accurate based on the data you've entered.
- Next, locate the boxes and whiskers section of the template. Fill in or verify the values for the lower quartiles, median, and upper quartiles to create a complete box plot.
- Check the offset section to adjust the whiskers if necessary. This is critical for visualizing outliers effectively.
- Once all the relevant fields are filled in accurately, confirm the completeness of your entries by reviewing them once more.
- Finally, save your changes, and choose to download, print, or share the completed Box Plots Template as needed.
Start filling out your Box Plots Template online today to visualize your data effectively.
A box plot is constructed from five values: the minimum value, the first quartile, the median, the third quartile, and the maximum value.