Loading
Get Worksheet: Interpreting Graphs
How it works
-

Open form follow the instructions
-

Easily sign the form with your finger
-

Send filled & signed form or save
How to fill out the Worksheet: Interpreting Graphs online
This guide provides clear instructions on how to complete the Worksheet: Interpreting Graphs online. By following these steps, you will be able to navigate the various sections of the worksheet effectively, ensuring you understand the graphs and their implications.
Follow the steps to successfully complete the worksheet.
- Click the ‘Get Form’ button to access the worksheet and open it in your preferred online editing tool.
- Begin by entering your name, date, and period at the top of the worksheet. This information helps identify your submission.
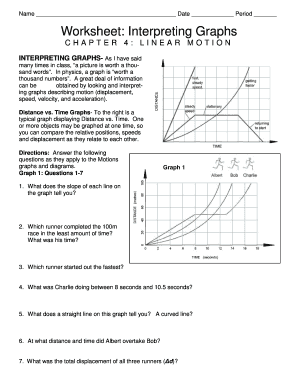
- Proceed to the first graph entitled 'Graph 1' and read the provided questions. These queries are designed to help you interpret the graph's information regarding motion.
- Answer questions 1 to 7 based on your analysis of Graph 1. Be sure to consider the slope of the lines and what they convey about the runners' speeds and displacements.
- Move on to 'Graph 2'. Carefully review questions 8 to 13, reflecting on the bicyclist's motion between different time intervals.
- Once you've interpreted Graph 2, document your answers to the respective questions, ensuring clarity and accuracy.
- Finally, analyze 'Graph 3' and respond to questions 14 to 17, focusing on velocity changes and calculating average velocity.
- After completing all questions, review your answers for completeness and correctness. Edit any necessary portions if you realize any mistakes.
- Once satisfied with your responses, choose to save your changes, download the completed worksheet, print it, or share it as instructed.
Complete your Worksheet: Interpreting Graphs online today to enhance your understanding of motion!
To analyze data from a graph effectively, start by identifying the main trends and any outliers. Consider both the overall shape of the graph and specific points that stand out. Using a structured approach, such as that found in our Worksheet: Interpreting Graphs, will help clarify your analysis and improve accuracy.