Loading
Get Mean, Median, Mode And Range And Dot Plots And Spiral Review
How it works
-

Open form follow the instructions
-

Easily sign the form with your finger
-

Send filled & signed form or save
How to use or fill out the Mean, Median, Mode And Range And Dot Plots And Spiral Review online
This guide provides clear and comprehensive instructions for completing the Mean, Median, Mode And Range And Dot Plots And Spiral Review online. Whether you are familiar with statistical concepts or not, this guide will assist you in navigating the various components of the form effectively.
Follow the steps to fill out the form successfully.
- Click the ‘Get Form’ button to access the form and open it in the appropriate editor. This allows you to begin the process of completing your document.
- Start by entering your name and the date in the designated sections at the top of the form. Ensure that the information is accurate as it will be associated with your submission.
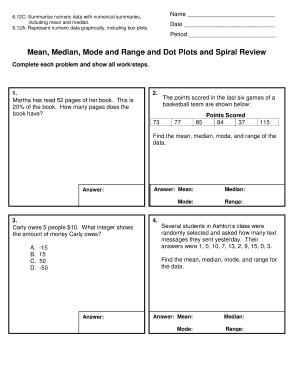
- Read through the initial problems carefully. For example, when answering the question about how many pages a book has based on what Martha has read, make sure to calculate the total number of pages by dividing 52 by 0.20.
- For the section requiring the mean, median, mode, and range calculations, input the scores of the basketball games provided. Use the appropriate statistical methods to find these values.
- Continue to the subsequent questions, which may involve different mathematical principles such as finding median and range based on student responses to text messages. Complete the necessary calculations and fill in your answers.
- For questions that involve creating a dot plot, draw the appropriate graphical representation based on the data provided, then calculate the median and range of the dataset.
- Finally, review all entered information for accuracy. Once you are satisfied with the completed form, you can choose to save your changes, download the document, print it, or share it as required.
Start filling out your Mean, Median, Mode And Range And Dot Plots And Spiral Review online today!
The range is the difference between the greatest and least value in a data set. The steps below calculate the above dot plot range: The greatest value is $5, and the least value is $1. The difference is $5 – $1, or $4.
Industry-leading security and compliance
US Legal Forms protects your data by complying with industry-specific security standards.
-
In businnes since 199725+ years providing professional legal documents.
-
Accredited businessGuarantees that a business meets BBB accreditation standards in the US and Canada.
-
Secured by BraintreeValidated Level 1 PCI DSS compliant payment gateway that accepts most major credit and debit card brands from across the globe.