Loading
Get Worksheet 5 Five-number Summary And Boxplots - Enetlearning
How it works
-

Open form follow the instructions
-

Easily sign the form with your finger
-

Send filled & signed form or save
How to use or fill out the Worksheet 5 Five-Number Summary And Boxplots - ENetLearning online
This guide provides detailed instructions on how to effectively fill out the Worksheet 5: Five-Number Summary and Boxplots on ENetLearning. By following the steps outlined below, you will gain a clear understanding of the form's components and how to utilize them to input your data accurately.
Follow the steps to complete the worksheet online.
- Click ‘Get Form’ button to obtain the form and open it in the editor.
- Begin by entering your personal information in the designated fields: name, date, and period. Ensure all details are accurate.
- Review the data provided for constructing boxplots and five-number summaries. Familiarize yourself with the example data sets presented in the worksheet.
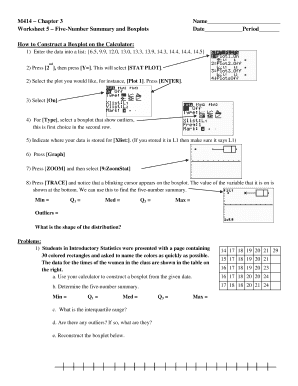
- Follow the instructions for using the calculator to enter your data. Refer to the initial example of entering a list of numbers in your calculator.
- Select the appropriate plot settings in your calculator. This involves navigating to the STAT PLOT section and choosing the boxplot option that indicates outliers.
- Input the location of your data storage in the calculator (typically L1). Ensure that the settings reflect this before proceeding.
- Generate the boxplot by pressing Graph, followed by ZOOM and selecting 9:ZoomStat to visualize your data effectively.
- Observe the boxplot on the screen. Utilize the TRACE feature to identify the five-number summary: minimum, first quartile (Q1), median, third quartile (Q3), and maximum.
- Document your findings for the five-number summary in the designated fields of the worksheet.
- After completing all required sections of the form, review your entries for accuracy. Save changes, download, print, or share the filled form as needed.
Complete your documents online today to ensure you are prepared for your statistics assignments!
The middle “box” represents the middle 50% of scores for the group. The range of scores from lower to upper quartile is referred to as the inter-quartile range. The middle 50% of scores fall within the inter-quartile range. Seventy-five percent of the scores fall below the upper quartile.