Loading
Get Making And Understanding Box And Whisker Plots
How it works
-

Open form follow the instructions
-

Easily sign the form with your finger
-

Send filled & signed form or save
How to fill out the Making and Understanding Box and Whisker Plots online
The Making and Understanding Box and Whisker Plots form is designed to assist users in practicing their understanding of data visualization. This guide provides step-by-step instructions on how to accurately complete the form and grasp the concepts involved.
Follow the steps to efficiently complete the form.
- Press the ‘Get Form’ button to acquire the form and open it in the editing interface.
- Begin by entering your name in the designated space at the top of the form. This identifies you as the user completing the worksheet.
- Fill in the date in the space provided to indicate when you are completing the form.
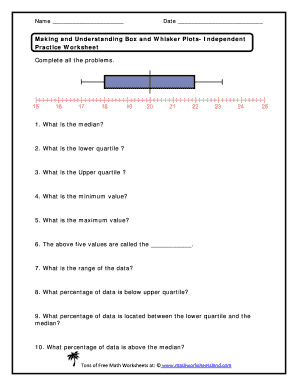
- Proceed to answer the questions sequentially. Start with question one, where you will identify the median value of the data set.
- Next, complete question two by determining the lower quartile. Ensure that you understand how to find this statistical measure.
- For question three, identify the upper quartile value. This requires analyzing the data set appropriately.
- Continue to question four, in which you will find the minimum value from the data.
- In question five, locate the maximum value of the dataset. This is crucial for understanding the range of your data.
- Question six asks you to define the term for the five values you have identified. Be clear about statistical terminology.
- For question seven, calculate the range of the data by subtracting the minimum value from the maximum value.
- In question eight, determine the percentage of data that lies below the upper quartile.
- Question nine asks for the percentage of data located between the lower quartile and the median. Be precise in your calculation.
- Finally, complete question ten to find out what percentage of data is above the median.
- Once all questions are answered, ensure to review your responses for accuracy. You can then save your changes, download the completed form, print it, or share it as needed.
Complete your box and whisker plots practice worksheet online for enhanced understanding of data visualization.
To create a box-and-whisker plot, we start by ordering our data (that is, putting the values) in numerical order, if they aren't ordered already. Then we find the median of our data. The median divides the data into two halves. To divide the data into quarters, we then find the medians of these two halves.
Industry-leading security and compliance
US Legal Forms protects your data by complying with industry-specific security standards.
-
In businnes since 199725+ years providing professional legal documents.
-
Accredited businessGuarantees that a business meets BBB accreditation standards in the US and Canada.
-
Secured by BraintreeValidated Level 1 PCI DSS compliant payment gateway that accepts most major credit and debit card brands from across the globe.