Loading
Get Baseball Bar Graph
How it works
-

Open form follow the instructions
-

Easily sign the form with your finger
-

Send filled & signed form or save
How to fill out the Baseball Bar Graph online
The Baseball Bar Graph is an essential tool for tracking the performance of players on a school baseball team. This guide provides detailed instructions on how to accurately fill out the graph and answer related questions.
Follow the steps to effectively complete the Baseball Bar Graph form.
- Click ‘Get Form’ button to obtain the form and open it in the editor.
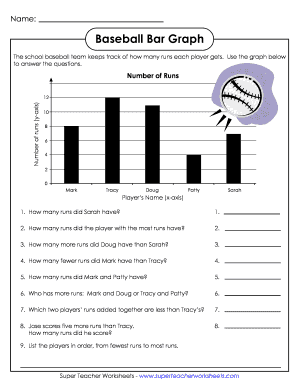
- Identify the players listed on the x-axis: Mark, Tracy, Doug, Patty, and Sarah. Using the graph, locate where each player's name intersects with their respective number of runs on the y-axis.
- Answer the first question regarding how many runs Sarah had. Find Sarah’s position on the graph and note the corresponding number on the y-axis.
- Proceed to the second question regarding the player with the most runs. Look for the highest point on the graph to determine who that player is and the number of runs they scored.
- For the third question, determine how many more runs Doug had than Sarah. Subtract the number of runs Sarah scored from Doug’s total.
- Next, for the fourth question, find out how many fewer runs Mark had compared to Tracy by comparing their respective runs on the graph.
- In the fifth step, calculate the total number of runs that Mark and Patty had by adding their individual runs shown on the graph.
- For question six, compare the combined runs of Mark and Doug to the combined runs of Tracy and Patty and identify which group has more runs.
- Question seven requires you to identify which two players' combined runs are less than Tracy’s. Find these players on the graph.
- Next, for question eight, calculate Jose's score by adding five runs to Tracy’s total.
- Finally, order the players based on their runs from fewest to most for question nine, referencing their positions on the graph.
- Once you have filled out all answers, make sure to save your changes, download, print, or share the form as necessary.
Start filling out the Baseball Bar Graph online to track player performance effectively.
Related links form
How to Make and Use a Bar Graph Collect data: The first step in drawing any graph is to collect data. ... Draw the axis: In any graph, there are two axes. ... Label the axis: First, label the x-axis. ... Draw the Columns: Finally, we draw the bars. ... Interpret the Data: Once the bar graph is complete, we can interpret it.
Industry-leading security and compliance
US Legal Forms protects your data by complying with industry-specific security standards.
-
In businnes since 199725+ years providing professional legal documents.
-
Accredited businessGuarantees that a business meets BBB accreditation standards in the US and Canada.
-
Secured by BraintreeValidated Level 1 PCI DSS compliant payment gateway that accepts most major credit and debit card brands from across the globe.