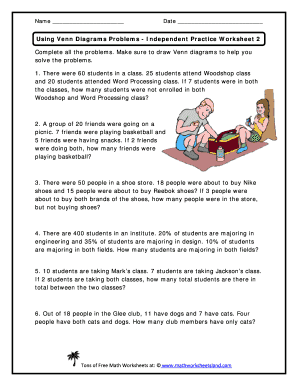
Ve the problems. 1. There were 60 students in a class. 25 students attend Woodshop class and 20 students attended Word Processing class. If 7 students were in both the classes, how many students were not enrolled in both Woodshop and Word Processing class? 2. A group of 20 friends were going on a picnic. 7 friends were playing basketball and 5 friends were having snacks. If 2 friends were doing both, how many friends were playing basketball? 3. There were 50 people in a shoe store. 18 people w.

How it works
  • Open form

    Open form follow the instructions

  • Easily sign form

    Easily sign the form with your finger

  • Share form

    Send filled & signed form or save

How to fill out the Using Venn Diagrams Problems Independent Practice Worksheet 1 Answers online

Filling out the Using Venn Diagrams Problems Independent Practice Worksheet 1 Answers online provides an interactive way to engage with mathematical concepts. This guide will assist you in navigating the form with clarity and confidence.

Follow the steps to complete the worksheet efficiently.

  1. Click ‘Get Form’ button to obtain the worksheet and open it in your preferred online editor.
  2. Begin by entering your name in the designated field at the top of the worksheet. This personalizes your form and ensures proper identification.
  3. Next, input the date in the space provided, which helps in tracking when the worksheet was completed.
  4. Read through each problem carefully. Ensure you understand what is being asked before attempting to solve it.
  5. For each question prompt, draw the appropriate Venn diagram in the given space or on a separate sheet. This visual aid will help you organize the information.
  6. Solve the problems using the information provided in each question, noting the values required to determine how many belong to each category.
  7. Double-check your calculations for accuracy before moving on to the next question.
  8. Once you have completed all the problems, review your answers to ensure they are clear and correctly reported.
  9. Finally, save your changes, and consider downloading or printing the completed worksheet for your records, or share it with your instructor if required.

Complete your worksheet online today and enhance your understanding of Venn diagrams!

Get form

Experience a faster way to fill out and sign forms on the web. Access the most extensive library of templates available.

Related content

Analyzing Venn Diagrams - Virginia Department of...

The Venn diagram below will be used with questions 1-14. Answer the following questions...

Learn more
Section 1.7 Applications using Venn Diagrams In...

In this section we will use Venn diagrams to solve word problems. We will put numbers in...

Learn more
Using Venn Diagrams Problems Independent Practice...

Using Venn Diagrams Problems Independent Practice Worksheet 2 Answers. FORUM. ... 1...

Learn more
Questions & Answers

Get answers to your most pressing questions about US Legal Forms API.

Contact support

What are the three parts of a Venn diagram?

The parts of a Venn diagram are the union, sets, and intersections.

0:00 6:05 Solving Problems with Venn Diagrams - YouTube YouTube Start of suggested clip End of suggested clip There are 50 students in this region. Here where math and english overlap. Next we're told that 70MoreThere are 50 students in this region. Here where math and english overlap. Next we're told that 70 were registered for an english. Class. And notice that of these 70 50 of them are also taking math.

A Venn diagram shows the relationship between a group of different things (a set) in a visual way. Using Venn diagrams allows children to sort data into two or three circles which overlap in the middle.

A Venn Diagram shows the logical relationships between groups of things. They are most often shown as two circles that intersect in the middle of the page. Attributes that are exclusive to each group are listed in the circles, and attributes that are shared by both groups are listed in the intersecting space.

Formulas to solve 3 overlapping sets in venn diagram Total = n(No Set) + n(Exactly one set) + n(Exactly two sets) + n(Exactly three sets) Total = n(A) + n(B) + n(C) – n(A and B) – n(B and C) – n(C and A) + n(A and B and C) + n(No Set) ... Total = n(No Set) + n(At least one set)

A Venn diagram is made up of two large circles that intersect with each other to form a space in the middle. Each circle represents something that you want to compare and contrast. Where the two circles intersect, you would write traits that the two things have in common.

A Venn diagram illustrates the relationships between two or more data sets. Venn diagrams are especially useful for highlighting similarities and differences and are commonly used to compare and contrast the characteristics of different data sets. In a Venn diagram, circles are used to represent each data set.

1:15 17:31 Problem Solving with Venn diagrams - YouTube YouTube Start of suggested clip End of suggested clip So we we are still sticking to the numbers and the same thing with football. There are 25 people butMoreSo we we are still sticking to the numbers and the same thing with football. There are 25 people but I've already included of them in the intersection.

Get This Form Now!

Use professional pre-built templates to fill in and sign documents online faster. Get access to thousands of forms.

If you believe that this page should be taken down, please follow our DMCA take down process here.

Get Using Venn Diagrams Problems Independent Practice Worksheet 1 Answers