Loading
Get Xy Scatter Excel Graph Evaluation Rubric
How it works
-

Open form follow the instructions
-

Easily sign the form with your finger
-

Send filled & signed form or save
How to fill out the XY Scatter Excel Graph Evaluation Rubric online
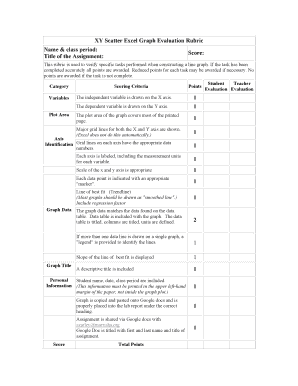
The XY Scatter Excel Graph Evaluation Rubric is a valuable tool for assessing the components of an excel graph. This guide provides structured instructions to help users efficiently fill out the rubric online, ensuring all necessary information is captured accurately.
Follow the steps to complete the evaluation rubric online.
- To obtain the form, locate and click the ‘Get Form’ button to access the XY Scatter Excel Graph Evaluation Rubric for online completion.
- Begin by filling out the 'Name & class period' and 'Title of the Assignment' fields at the top of the rubric. Ensure this information is accurate as it identifies your submission.
- Proceed to the scoring criteria section, where you will evaluate your graph based on several categories such as variables and plot area. For each criterion, check off whether you have met the requirements and assign points accordingly.
- In the 'Graph Data' section, ensure you enter details such as the independent and dependent variables, axis labels, and any necessary data point markers. Carefully check for a line of best fit and that your data matches the provided data table.
- Include a descriptive title for your graph in the specified field. This title should accurately reflect what your graph represents.
- Complete the 'Personal Information' section by including your name, date, and class period. This information must be printed in the upper left-hand margin of the document, separate from the graph.
- Make sure to copy and paste your graph onto Google Docs as instructed and place it under the correct heading in your lab report.
- Finally, save your changes, and consider downloading or printing the completed rubric. Share your assignment via Google Docs with the specified email address, ensuring the document is appropriately titled.
Start completing your XY Scatter Excel Graph Evaluation Rubric online today!
Highlight the two columns you want to include in your scatter plot. Then, go to the “Insert” tab of your Excel menu bar and click on the scatter plot icon in the “Recommended Charts” area of your ribbon. Select “Scatter” from the options in the “Recommended Charts” section of your ribbon.